THE HIDDEN REVIVAL OF PLATINUM AND PALLADIUM
“Platinum Breaking Out on Surging Demand From China” Bloomberg, May 20th 2025
“BMW bets on petrol and sees rocky road to electrification… BMW has pledged to continue investing in combustion and hybrid technologies.” Financial Times, Feburary 11, 2025
“South African miner Impala Platinum may close its Canadian palladium mine earlier than planned after prices for the metal used in gasoline vehicles have plummeted more 70% over the last three years.” The Northern Miner, February 27, 2025
The time has come, we believe, to turn serious attention-and capital-towards the platinum group metals and their related equities. Over the past 18 months, a growing number of supply and demand signals have begun to flash in concert, suggesting that a long-overlooked corner of the commodity world may be on the cusp of making a significant bullish move.
We say this with some sense of historical symmetry. It has been a long while since we last held meaningful positions in the global PGM markets. In fact, one has to rewind the tape all the way back to the late 1990s and early 2000s to find us actively invested in the sector. For the curious (and the nostalgic), we’ve included a Barron’s commodity column of ours dated January 15, 2000-in retrospect in was a great call.
The late ’90s, of course, offered a classic setup: an obscure group of metals largely dismissed by the broader investment community, and a handful of public equities priced for irrelevance. It was precisely then that the opportunity proved greatest. Between their lows in the late 1990s and their highs just before the 2008 financial crisis, shares of South Africa’s Rustenburg Platinum (now Anglo American Platinum, ANGPY) and Impala Platinum (OTCQX:IMPUY) staged extraordinary bullish moves-rising, in dollar terms, by a factor of 30 and 60, respectively.
Today, we believe investors are once again being offered an opportunity that bears more than a passing resemblance to that earlier moment-one that, in time, could prove every bit as spectacular.
The bear market in platinum, now in its sixteenth year, has become a study in endurance. Palladium, for its part, has spent nearly four years in decline. Sentiment is bleak. The prevailing narrative-repeated with the assurance of conventional wisdom-holds that electric vehicles will permanently erode demand for platinum group metals. It’s a tidy story, but one that, we would argue, has already begun to unravel.
In our view, today’s deficit conditions in both platinum and palladium are not only real they’re likely to persist far longer than the market currently expects. Demand has held up with surprising resilience. Supply, from both mined and recycled sources, continues to disappoint. And most importantly, investment demand-a vital swing factor in the platinum market-is beginning to re-emerge.
As for the equities, they’ve absorbed every bit of the bearish mood. Since peaking just three years ago, the major PGM producers have fallen nearly 80%. They are, to put it plainly, priced for despair. But if we are right-if PGM prices are indeed poised to move materially higher then these companies, trading at valuations last seen in the depths of previous cycles, may once again offer the kind of extraordinary returns we witnessed a quarter-century ago. The time to act, we believe, is now.
What, then, makes us so bullish?
There are three key reasons why we think the bear market in PGMs is drawing to a close each of which we’ll explore in the sections that follow.
Demand Shifts: A Turning Tide for PGM Consumption
Shifts in demand are now well underway that may prove enormously consequential for platinum group metals. Roughly 65% of global platinum, palladium, and rhodium production flows into automotive catalytic converters. And yet, in recent years, investor sentiment has turned uniformly bearish on this critical source of demand. The prevailing thesis, repeated almost ritualistically, holds that the rise of electric vehicles (EVs) will render PGMs increasingly obsolete.
That thesis, we believe, is unravelling as we write.
Recent disappointments in global EV sales have already begun to chip away at the most aggressive adoption forecasts. Where once a straight line was drawn between the present and a fully electrified automotive future, industry analysts are now beginning to consider a more nuanced scenario-one in which internal combustion engine vehicles maintain measurable growth well into the 2030s. That, needless to say, would represent a profoundly constructive development for PGM demand.
Our readers will recognize the view. We have long been critical-some might say heretical about the consensus on EV penetration. The narrative, while tidy, never quite aligned with the data. The recent string of missed sales targets has only deepened our conviction. What was once a minority view-grounded in thorough research-is increasingly difficult to dismiss.
Consider the numbers: global ICE vehicle sales peaked in the late 2010s at 95 million units, fell as low as 75 million during the pandemic years, and have since rebounded to an annualized rate nearing 90 million. Even granting the assumption-borrowed from the excellent work of Rob West at Thunder Said Energy-that EV sales grow from 14 million units in 2023 (a 15% market share) to 40 million by 2030 ( 30% share), total ICE vehicle sales could still hold steady near 90 million through at least 2033.
That’s the conservative case. Should EV adoption stumble further, as we believe it might, the upside for PGM demand is even greater.
But there is another, less-discussed trend that may ultimately prove just as important: the rise of the hybrid vehicle. While we remain skeptical of EV economics and utility, we have become increasingly bullish on hybrids-and for a simple reason. Our analysis suggests hybrids offer superior energy efficiency to both EVs and traditional ICE vehicles. If correct, this efficiency advantage could drive widespread adoption, with implications that are deeply positive for PGM markets.
Hybrids have been curiously underexamined by investors and analysts alike. That is a gap we intend to address in this essay. Understanding the true energy economics of hybrid drivetrains is not just an academic exercise-it is key to understanding how PGM demand may evolve in the coming decade.
Why? Because hybrids require more PGMs than ICEs. Catalytic converters operate best at high temperatures. In a traditional ICE vehicle, the engine runs continuously, allowing the converter to reach and maintain those optimal temperatures. In a hybrid, the engine cycles on and off, which causes the catalytic converter to run cooler and less efficiently. To compensate, automakers must increase the loading of platinum group metals-sometimes by as much as a full additional gram per vehicle.
As hybrids gain share at the expense of both EVs and ICEs, the added PGM intensity becomes an important and underappreciated source of future demand-one that few analysts have yet chosen to highlight.
It’s a popular notion these days that electric motors are marvels of efficiency. And indeed they are-when judged on their own without comparison. But that neat superiority begins to unravel once one considers the full cost of generating electricity and the heroic energy it takes to produce the battery. In point of fact, when one begins with a theoretical 100 kilowatt-hours of primary energy, a plain internal combustion engine car will carry its driver roughly 20 percent farther than an electric vehicle drawing its lifeblood from a natural gas-fired grid. And-this might startle the Tesla crowd-50 percent farther than a similar EV drawing its power from renewable sources.
It turns out that electric motors, for all their charms, labor under three great burdens: the prodigious energy cost of electricity production itself, the even more staggering energy required to manufacture the battery, and the not-insignificant energy necessary to drag that very battery around once it’s installed. The EV, in short, is a sleek machine weighed down by its own invisible obligations.
This, then, is the stage on which the hybrid vehicle performs its quiet little miracle.
To see why the hybrid is so effective, one must first examine how it-and its more gregarious cousin, the plug-in hybrid-goes about the business of turning energy into movement. A traditional hybrid uses a modest battery, typically just 1 to 2 kilowatt-hours in size, to assist an electric drive train. This battery is not a long-distance runner. It exists not to extend range but to lend a strong push when the car is starting from a stop-an activity at which electric motors excel and combustion engines struggle. And unlike an EV, the hybrid’s battery does not draw power from the grid. Rather, it harvests the kinetic energy typically lost during braking-via that ingenious mechanism known as regenerative braking-and stores it for the next start-up. This is not a trick; it is engineering alchemy.
The result? Efficiency gains that border on the scandalous. Where a respectable ICE vehicle might return 37 miles per gallon, the hybrid manages 58 . In terms of energy, the hybrid demands just 63 kilowatt-hours per 100 miles traveled, versus 98 for its combustion cousin. And when one tallies the energy cost of battery manufacturing over the vehicle’s life, the hybrid again comes out ahead: a 2 kwh battery adds a mere 0.3 kwh per 100 miles, compared to a lumbering 14 kwh per 100 miles for the all-electric competitor. The hybrid’s battery is not only cheaper to build-it’s lighter to haul. And that matters.
All told, if one begins again with that same 100 kwh of primary energy, the hybrid will carry its occupants 56 miles: 40 percent farther than the ICE car, 65 percent farther than the EV powered by natural gas, and an astonishing 220 percent farther than an EV whose electricity comes from renewables.
Enter, now, the plug-in hybrid-the ambidextrous vehicle that straddles the line between EV and traditional hybrid. A typical plug-in hybrid (or PHEV as they are called) carries a 12 kwh battery, about one-eighth the size of a full EV’s. When burning gasoline, it behaves much like a traditional hybrid-efficient and unassuming. When in electric mode, it may offer 30 to 40 miles of pure battery range. As such, the PHEV’s overall efficiency falls somewhere in the middle. It benefits from not lugging around a battery the size of a steamer trunk, but it is still shackled to the low net energy efficiency of electricity production. Assuming a 50/50 split between electric and gasoline operation, we calculate the PHEV will achieve 50 miles per 100 kwh of primary energy- 25 percent more than the ICE, but 12.5 percent less than the traditional hybrid.
Now, for the thorough: both the traditional hybrid and the plug-in hybrid demand more platinum group metals in their catalytic converters than the standard ICE car. We have, of course, accounted for this. One ought not to leave out the cost of precious metals when tallying the efficiency of modern miracles.
And so the hybrid, in either of its guises, emerges not as a compromise but as a kind of mechanical ideal-an ideal solution today’s energy world, where efficiency is not a luxury, but a necessity.
The surge in PGM demand driven by hybrids is only part of the story. A second, equally important force is now gathering momentum: the steady tightening of global vehicle emissions standards.
Today, 98% of all new vehicles sold worldwide are equipped with catalytic converters. The average PGM loading per converter is currently estimated at 5 grams. We believe that figure is heading higher-and soon.
Ultimately, total demand for platinum group metals from the auto sector hinges on two variables: how many internal combustion engine vehicles (hybrids included) are sold, and how much PGM material is used per vehicle. As we’ve already discussed, we believe that even under conservative assumptions, ICE vehicle sales will remain flat through at least 2033-a position that may seem controversial in the current narrative environment but is, in our view, well supported by data.
The second variable-PGM loadings per vehicle-is even more straightforward, and arguably more powerful. Several factors are converging that we believe will lead to steadily increasing loadings in the years ahead.
At its core, the physics is simple: the more PGMs a catalytic converter contains, the better it performs. Higher loadings yield more complete conversion of unburned hydrocarbons, carbon monoxide, and nitrogen oxides into less harmful byproducts like carbon dioxide and water vapor. And as emission standards become progressively more stringent, so too must the efficacy of the converters.
We are already seeing this dynamic play out. In markets where regulations are tightest-Europe and Japan-catalytic converters now contain between 7 and 9 grams of PGMs. In the United States, the figure averages closer to 5 grams. In China and much of the developing world, the current range is lower still, roughly 3 to 4 grams.
But that, too, is about to change. Both Europe and China are set to implement new emissions regulations between now and 2030. In Europe, the incoming EU7 standard for light-duty vehicles and the EU VII standard for heavy-duty transport are expected to require significantly higher PGM loadings. China is likewise preparing to ratchet up its regulatory framework, following a similar path.
In China, the upcoming CN7 emissions regulation is expected to mandate a significant reduction in gaseous pollutants-and with it, a sharp increase in PGM usage. The last such regulatory tightening in China came in 2021 and resulted in platinum group metal loadings rising from 2.5 grams to nearly 4 grams per vehicle. Under CN7, loadings are projected to climb further, reaching 5 grams per vehicle-bringing China into alignment with global averages.
India, meanwhile, is moving in a similar direction. The Bharat Stage 7 (BS7) emission standard is scheduled to take effect in July 2025. Intended as India’s counterpart to Europe’s emissions framework, BS7 will similarly necessitate a meaningful rise in PGM loadings across the vehicle fleet.
There is another dimension to this regulatory tightening that merits attention: the expanded use of advanced emissions-control technologies. Chief among them is turbocharging. By forcing additional air into the engine’s combustion chamber, turbocharging boosts power and efficiency-a desirable outcome. But the trade-off is greater particulate matter, which in turn requires more platinum group metals in the catalytic converter to meet emissions thresholds. Current estimates suggest that turbocharged engines require an additional 2 grams of PGMs per vehicle to manage the extra emissions.
Turbocharging, at present, is used in just half of all newly produced ICE vehicles globally. That figure seems unlikely to remain static. As emissions standards grow stricter, turbocharging penetration will almost certainly rise, and with it, the demand for PGM-intensive catalytic converters.
Taken together, these factors form a clear and strengthening trend: China and India moving toward tighter regulatory regimes, turbocharging becoming more widespread, and catalytic converter loadings rising accordingly.
Most analysts project a future for platinum group metals in which demand drifts steadily lower-an orderly decline paced by the presumed ascendancy of electric vehicles. We are not among them.
On the contrary, we believe PGM demand is far more likely to surprise to the upside in the years ahead. Long-term forecasting in this space is rare, and when attempted, often cursory. But here we again lean on the deeply detailed modelling done by Rob West at Thunder Said Energy, whose work we believe merits particular attention.
Total demand for platinum, palladium, and rhodium currently stands at 18.7 million ounces. Of that, 65% is consumed in catalytic converters, 10% in jewelry and investment applications, 9% in chemical processes and oil refining, 8% in electronics and glass, and roughly 3% in medical uses. Mr. West’s long-range forecast, incorporating the very demand vectors we’ve been discussing throughout this essay, calls for total PGM demand to rise to nearly 23 million ounces by 2032-a 23% increase from current levels.
Importantly, that forecast includes what we view as overly optimistic assumptions for EV adoption. Given our far more conservative view of EV penetration, we suspect Mr. West’s projection could ultimately prove understated.
It is also worth noting what his forecast does not include: any contribution from hydro-gen-powered vehicles. There is a contingent of analysts who believe hydrogen fuel cells will eventually displace a meaningful portion of both light- and heavy-duty vehicle fleets. We are not among them either.
Though we have not yet written in detail on the subject, our internal calculations suggest that hydrogen-powered vehicles suffer from a critical flaw: poor energy efficiency. Much like battery EVs, hydrogen fuel cells struggle to compete with the internal combustion engine, and even more so with hybrids, which we believe offer the most compelling efficiency profile of any drivetrain currently available.
That said, if we are wrong-and hydrogen-powered vehicles were ever to achieve substantial market share-it would represent a major boon for PGM demand. While our analysis suggests this is unlikely, PGMs represent a free call option on hydrogen penetration, and we are never above taking on a free call option.
Investor sentiment toward the platinum group metals has turned sharply negative, driven in large part by a prevailing assumption that demand is destined to decline. As we’ve outlined in the preceding pages, we believe this view is not only overly pessimistic-it is fundamentally flawed. The market, in our judgment, has significantly underestimated the likely trajectory of PGM demand between now and the early years of the next decade.
Supply demand trends have turned extremely positive. Both the platinum and palladium markets have now swung into deficit-and by all indications, those deficits are only going to get worse. After recording a 750,000-ounce shortfall in 2023 and a 680,000-ounce deficit in 2024-figures that represent nearly 9% of total global demand-the platinum market is now on track for a third consecutive year of undersupply. According to estimates from the World Platinum Investment Council, the 2025 deficit will approximate 500,000 ounces.
Three factors are principally at work here. First, mine supply out of South Africa has contracted by roughly 400,000 ounces. The culprit is price: sustained weakness has forced producers to curtail output from deep, high-cost shafts-operations that had long been on the edge of economic viability. We’ll return to that issue in a moment.
Second, recycled supply has also come under pressure, down some 300,000 ounces over the last year. The decline has been concentrated in recycled autocatalysts, and the reasons are as much economic as behavioral. Used car prices have surged in recent years, and with them, the average age of the vehicle fleet. Drivers, particularly in the United States, are simply holding onto their cars longer. As of 2024, the average age of vehicles on American roads has reached a new record: 12.6 years-an increase of six months since 2020.
The consensus view is that scrap supply will rebound in 2025 and into 2026, as older vehicles cycle out of use. We’re not so sure. New car prices remain elevated, and the recent reintroduction of tariffs under President Trump’s economic policy playbook is adding fresh upward pressure. If price alone weren’t enough to delay trade-ins, there is now a regulatory wrinkle worth noting.
Tucked into the 2021 Infrastructure Investment and Jobs Act is a little-discussed provision mandating that, starting in 2026, all new vehicles sold in the U.S. be equipped with alcohol detection systems. Should the law remain in force-and should efforts to repeal it prove unsuccessful-we believe many Americans will respond as they often do: by opting out. The used car market, already tight, could become a haven for drivers keen to avoid the surveillance built into the next model year.
If that happens, the rebound in recycled PGM supply may prove far weaker than expected. And if that’s the case, prices will have to rise-meaningfully-to draw secondary material back into the market.
And finally, it bears repeating: total PGM demand from the auto sector has proven far more resilient than commonly assumed. The widely publicized expectations for aggressive EV penetration-once treated as near-certainties-have thus far failed to materialize.
The bright spots in industrial demand, however, have been offset by a sharp collapse in investment appetite-particularly for platinum. The culprits are familiar: rising real interest rates and falling spot prices, a combination that has drained enthusiasm from western investors. It’s a pattern not unlike what has taken hold in gold and silver markets over the past several years.
Since 2020, investment in physical platinum has declined by 75%, driven in large part by redemptions from physical platinum ETFs-again, mirroring the dynamics in precious metals more broadly. At their peak in 2019 and 2020, combined demand from bars and ETFs reached 1.3 and 1.6 million ounces, respectively. By 2023 and 2024, that figure had shrunk to just 400,000 ounces.
That said, the tide may be turning. Falling real interest rates appear to be rekindling interest in physical holdings-platinum included. We monitor sixteen primary physical platinum ETFs. As illustrated in the chart below, the funds have halted their prior liquidations and have begun modestly accumulating metal once again-a tentative but encouraging sign that western investment demand may be returning.
FIGURE 1 Metal Held in Platinum ETFs
Most analysts continue to forecast a return to surplus in platinum markets by 2026. But for that to happen, two things must occur simultaneously: recycled supply must rebound substantially, and investment demand must remain depressed. On both fronts, we are skeptical.
Large deficits over the past two years have meaningfully eroded above-ground inventories. After peaking near 5 million ounces in 2022, above-ground platinum stocks have declined by approximately 1.5 million ounces. If our projections for 2025 are correct, inventories will fall to 3 million ounces-down nearly 40% in just two years.
We believe the platinum market remains in structural deficit, and may do so for several years to come. Demand, particularly from the auto sector, continues to outperform expectations. Mine supply continues to disappoint-especially given that nearly 40% of global PGM production is now uneconomic at current prices. Recycled supply, expected to rebound, has shown little inclination to do so. And finally, western investment demand-currently at a cyclical low-appears poised for a meaningful recovery.
Palladium, for its part, is exhibiting many of the same dynamics now unfolding in platinum. That market, too, has operated in deficit for three years running, with 2025 expected to extend the streak. The combined shortfall over 2023 and 2024 approached 1.5 million ounces-nearly 15% of global demand.
The primary driver has been a steep decline in recycled palladium supply. In 2021, the World Platinum Investment Council estimated that recycled palladium totaled roughly 3.4 million ounces. That figure has since fallen by approximately 900,000 ounces, a decline largely attributable to the same structural factors affecting platinum: elevated used car prices and a steadily aging vehicle fleet. Adding to the shortfall is a 300,000-ounce reduction in primary supply, concentrated in South Africa.
Most analysts expect recycled palladium supply to rebound to 2021 levels-an assumption that underpins the broader consensus view that palladium markets will swing back into surplus by 2026. But as we’ve just outlined, the same forces weighing on recycled platinum are very much at play in palladium as well.
If we are correct-and if elevated used car prices and the looming requirement that all new U.S. vehicles sold from 2026 onward include mandatory ignition interlock devices lead consumers to delay new purchases – then expectations for a swift recovery in recycled palladium supply may once again prove overly optimistic. In that case, the current deficits in the palladium market could persist far longer than most forecasters are prepared to admit.
Low Prices, Tight Margins, and Supply Under Siege
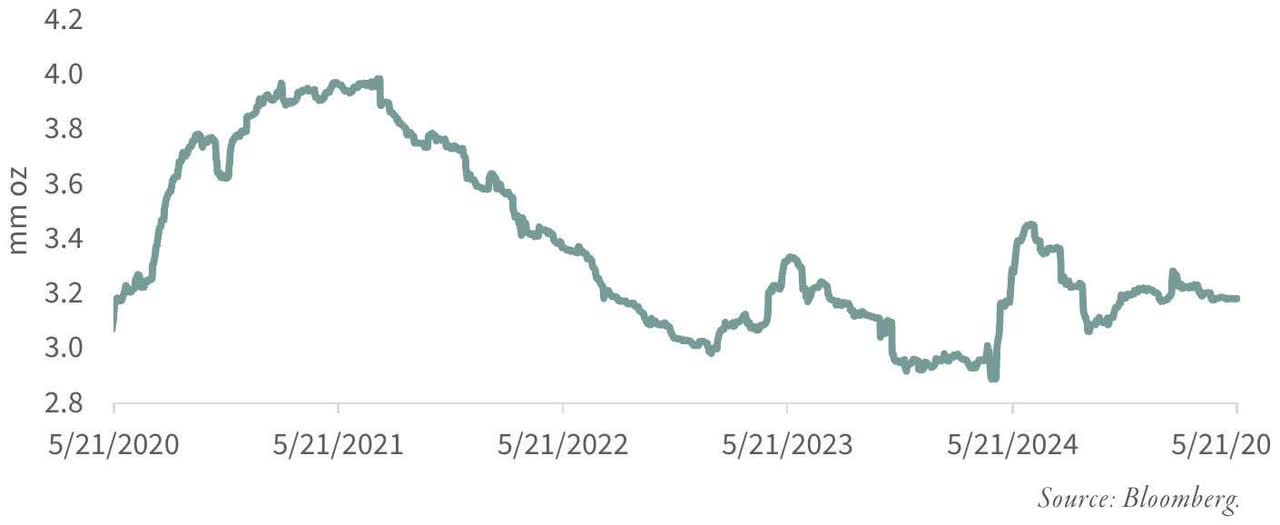
Over the past three years, the average basket price received by our universe of platinum group metals producers has declined by nearly 50%. In mid-2021, that basket approached $3,000 per ounce. Today, it has slipped to as little as $1,200. At these levels, nearly 40% of global PGM mine supply is operating at or below the cash cost threshold, according to recent data from the World Platinum Investment Council.
In our experience, when broad swaths of an extractive industry begin operating with negative cash margins, speculators find it increasingly difficult to push prices lower. Markets, as they say, find their bottom when selling meets resistance-and profitability disappears.
To underscore just how far margins have compressed, we’ve compiled data across the major PGM assets operated by the industry’s three dominant producers: Anglo American Platinum (Amplats), Impala Platinum, and Sibanye-Stillwater (SBSW).
The individual mine data confirms what the aggregate numbers suggest: profitability across the industry has evaporated. The impact on supply has already begun to materialize. Since the early 2020s, platinum production in South Africa has fallen from 4.5 million ounces to 4.0 million-a decline of 500,000 ounces. Palladium output, meanwhile, has slipped from 2.7 million to 2.3 million ounces.
More recently, Impala Platinum disclosed that it is now weighing the closure of its Lac des Iles mine in Canada. The mine, which produces approximately 280,000 ounces of PGMs annually- 90% of which is palladium-is operating deep in the red. Should it be shuttered, global palladium supply would fall by roughly 4%.
New supply, for its part, is limited. Only one notable mine-Platreef, on the eastern limb of South Africa’s Bushveld Complex-is scheduled to commence production in the near term. Phase 1 is expected to begin in the fourth quarter of 2025, with output of approximately 100,000 ounces split evenly between platinum and palladium. Phase 2, starting in 2027, would bring production to 450,000 ounces annually by 2029. Phase 3, targeted for 2033, would lift total output to 1 million ounces per year.
F I G U R E 2 . 1 Impala Platinum Cash Operating Margin
Source: Company Filings.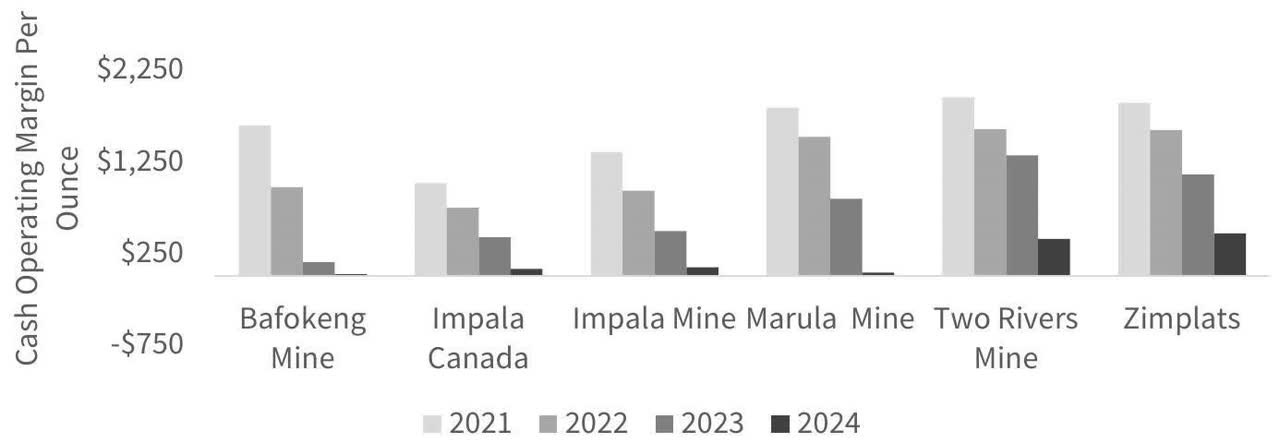
F I G U R E 2 . 2 Anglo American Platinum Cash Operating Margin
Source: Company Filings.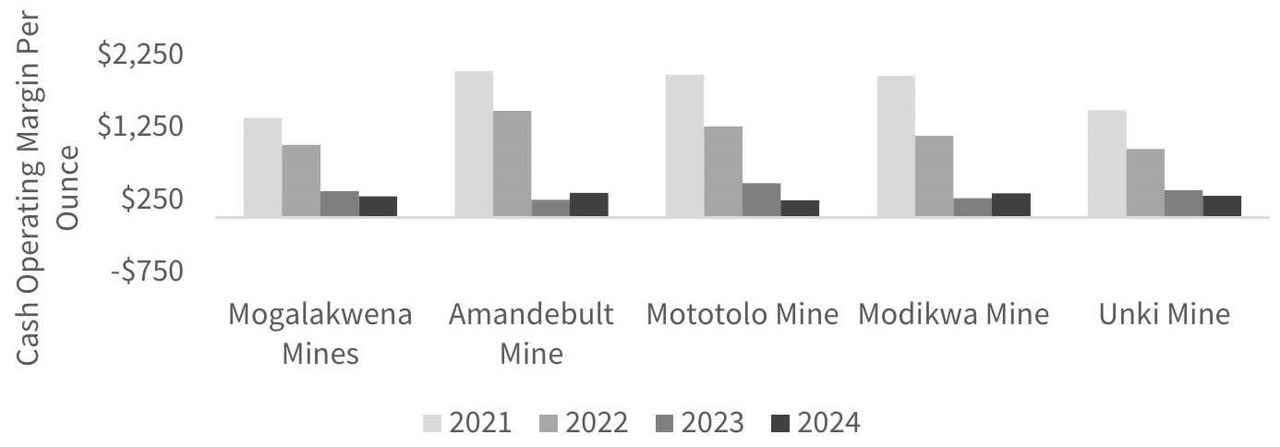
F I G U R E 2 . 3 Sibanye-Stillwater Cash Operating Margin
Source: Company Filings.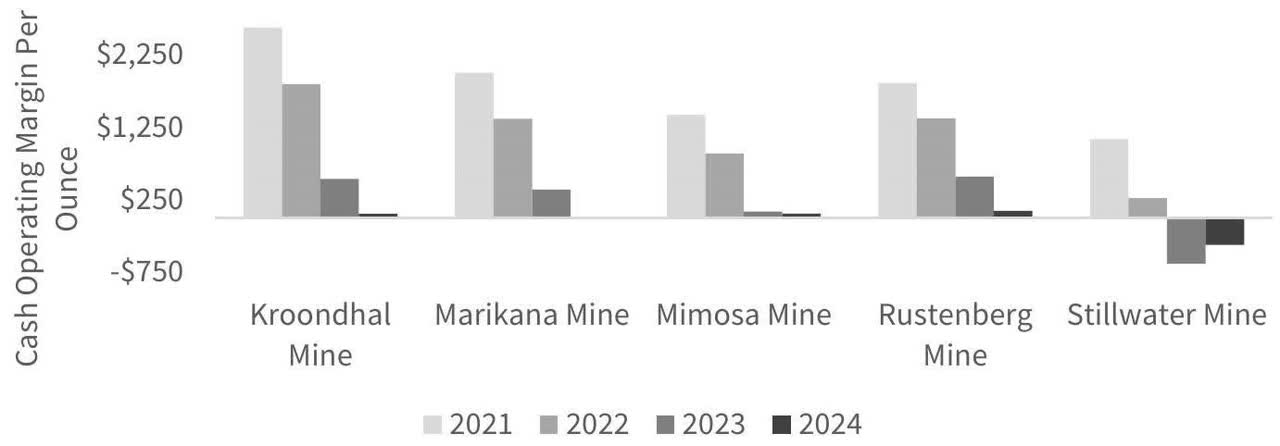
Even under conservative assumptions for demand growth between now and 2035, we believe the market can readily absorb this incremental supply-without exerting meaningful downward pressure on prices. Indeed, one might argue the opposite: even with Platreef’s future production fully priced in, platinum and palladium markets may struggle to exit their current deficit conditions.
The South African mining complex-long the backbone of global PGM production-is facing mounting structural constraints. Decades of underinvestment, coupled with geological depletion, mean that even sharply higher prices may fail to unlock new volume. In this context, the path to materially expanding supply looks narrow, costly, and slow.
Robust demand. Contracting supply. Persistent deficits. And an investment consensus built on a narrative we do not believe will hold. It is, in our view, the textbook setup for a bull market to begin.
As we wrote at the outset of this essay: we believe the time to buy PGMs-and the companies that produce them-is now.
1Q 2025 Natural Resource Commentary
Has the Great Commodity Bull Market Quietly Begun?
It is beginning to look that way. The signs are not yet shouted from the rooftops, but they are accumulating with the kind of quiet insistence that tends to precede louder declarations. As we noted in our last letter, we remain persuaded that the bear market in commodities and the mirror-image boom in high-flying technology stocks-are not merely coincidental phenomena, but rather two sides of the same curious coin: the global “carry trade.” The term, coined by Lee, Lee, and Coldiron in their prescient book The Rise of Carry, refers to a structure in which the world borrows low and lends high-not merely in currency markets, but in equities, bonds, and, crucially, in the asset allocation preferences of investors writ large.
If the theory holds water-and we think it does-it follows that the immense run-up in mega-cap growth stocks, and the protracted languishing of commodity-related equities over the past decade and a half, are inextricably linked. And if that’s true, then it stands to reason that the unraveling of one side of the trade may, at long last, bring about the unraveling of the other.
A preview of this unwinding played out, however briefly, in 2022. The invasion of Ukraine sent both commodity prices and interest rates soaring, a shock that appeared-if only for a moment-to knock the carry trade off its axis. The Nasdaq 100, home to the gilded names of the technology elite, dropped 35% that year. Meanwhile, the S&P North American Natural Resource Sector Index-a reliable proxy for natural resource equities-rose nearly 30%.
It was, in hindsight, something of a false start. The forces that had governed the previous cycle quickly reasserted themselves. In 2023, the Nasdaq 100 rebounded sharply, rising over 50%, and then tacked on another 27% in 2024. Commodities and their equities, for their part, resumed their sullen torpor.
Still, we would not dismiss the episode of 2022 as meaningless. Far from it. Rather, we view it as a harbinger-a rehearsal, if you will-for a more dramatic performance still to come. The structural underpinnings of the carry trade remain vulnerable, and the pressures building beneath them are mounting. The timing is, as ever, uncertain. But the logic is firming, and the probabilities, we think, are increasingly on the side of a major reversal-with all the attendant consequences for investors on both sides of the seesaw.
Could the weakness in technology stocks during the first quarter-paired with the simultaneous strength in commodity equities-be the real beginning of the end for the carry trade? It would not be the first false alarm, of course. We saw a promising tremor in 2022, only to watch markets settle back into their old rhythms. But this time may be different. Or so the mounting evidence would have us believe.
The murmurs are growing louder. Talk of a “Mar-a-Lago-style” regime shift in monetary policy, fresh volleys in the tariff skirmishes, and the recent rally in gold-all hint at a deeper unease in the foundations of the financial order as we’ve known it. Meanwhile, commodities and their equities have begun to stir. In the first quarter, prices for raw materials firmed, even if unevenly. The Goldman Sachs Commodity Spot Index, weighted heavily toward energy barely budged-up less than half a percent. But the Rogers International Commodity Index, with a broader mix of metals and agricultural goods, rose more than 5%.
The equity markets told a similar story. Resource stocks, which had slumped in the final months of last year, rebounded. The S&P North American Natural Resource Sector Index populated largely by the largest-cap energy names-rose about 7%. The S&P Global Natural Resources Index, with greater exposure to metals and agriculture, matched the gain.
And on the other side of the proverbial trade? Weakness. The kind of weakness one would expect, in fact, if the carry trade were indeed beginning to unravel. The S&P 500 (SP500, SPX), top-heavy with the so-called “Magnificent Seven,” fell more than 4% over the quarter. The Nasdaq 100, home to the mega-cap darlings of the last decade, dropped over 8%.
Is this the true beginning of the great unwind? We cannot say for certain. But the signs those subtle, stubborn signals the market sometimes sends before a major turn-now point in that direction. It feels, more and more, as if we are nearing the edge.
Precious Metals
Among the many eddies in the commodity markets this past quarter, few were as striking or as symbolically loaded-as the rally in precious metals. Gold and silver, long dormant, stirred back to life in a move that commanded attention from central bankers and retail investors alike. In response to a swirl of macro forces-including President Trump’s continuing efforts to reorder not only trade policy but the global geopolitical landscape-both metals posted returns of 19% for the quarter.
The enthusiasm did not stop at the metals themselves. Equities tied to gold and silver also advanced. The GDX ETF, a benchmark for gold mining stocks, climbed more than 35%, while the SIL ETF, which tracks silver-related equities, rose a solid 25%.
Notably, central banks continued to accumulate bullion-a trend that has become something of a motif in recent years. More interesting still was the return of the Western investor. After stepping back in the fourth quarter-spooked, it seems, by a surging dollar-Western holders of physical gold ETFs came rushing back. According to our tracking of 18 such funds, net liquidations in Q4 gave way to vigorous buying in Q1, with Western investors accumulating 150 tonnes. The World Gold Council’s data suggests central banks were buying right alongside them.
Yet a curious contradiction persists-one that we view as especially bullish. Even as Western investors return to the metal itself, they remain net sellers of gold equities. In our view, this divergence-physical gold accumulation paired with equity liquidation-speaks more to positioning mechanics than to a change in fundamental conviction. And as we outline in the gold section of this letter, it may well mark the early innings of what we believe is the defining gold bull market of the decade.
North American Natural Gas
Natural gas prices in North America extended their recent strength through the first quarter, rising another 13% on the heels of a solid fourth-quarter performance. This winter, unlike the oddly warm affairs of 2022-2023 and 2023-2024, proved refreshingly normal. December was mild, January bit hard, February hovered around average, and March-true to modern form-warmed up again.
In response to these more seasonal temperatures, natural gas inventories have made a remarkable round-trip. At the end of last year’s withdrawal season, U.S. storage stood nearly 600 billion cubic feet above the 10-year average-a towering 40% surplus. But as of this writing, with the current withdrawal season drawing to a close, that excess has shrunk dramatically. Inventories now sit just 100 billion cubic feet above the 10-year average, a modest 5% surplus.
The backdrop is growing more intriguing by the week. Supply growth in the U.S. has stalled an inflection point that often signals trouble ahead for bears. And against this tightening domestic balance looms an international pull: 6 billion cubic feet per day of new LNG export capacity is set to come online over the next 18 months. Meanwhile, international gas prices remain nearly three and a half times higher than their U.S. counterparts. The pressure for convergence is mounting.
Whether the alignment comes gradually or all at once, we believe it will happen-and likely before year’s end. For a deeper dive into the numbers, and particularly the emerging tightness on the supply side, we invite you to turn to the “Natural Gas” section of this letter.
Copper
Copper turned in a commanding performance in the first quarter, rising 25%-a standout showing amid an otherwise uneven base metals landscape. The rally was likely driven largely by mounting concerns over potential supply shortages in the United States, spurred in no small part by renewed trade skirmishes under the Trump banner. Whether this is a passing fear or a more lasting structural anxiety remains to be seen, but the market responded with conviction.
Elsewhere in the base metals complex, the picture was mixed. Zinc slipped 4%, aluminum dipped 1%, and nickel managed a modest 4% gain. Equities tied to copper more or less followed suit. The COPX ETF, which tracks copper mining stocks, rose just over 2%-a tepid move relative to the metal’s own leap. Broader base metal equities, meanwhile, faltered. The XBM ETF (XBM:CA), a proxy for the S&P Global Base Metals Index, declined by more than 4%.
We have written in prior letters about the conflicting signals emanating from the copper market-signals that continue to demand attention. Since the dramatic short squeeze in May 2023, exchange warehouse inventories have climbed markedly, a trend that has at times seemed at odds with our own modeling of short-term supply and demand dynamics.
According to data from the World Bureau of Metal Statistics (WBMS), our models indicated that copper remained in structural deficit for most of the post-squeeze period-hardly a backdrop in which inventories should be swelling. But with the latest WBMS release, which includes data through February, the story appears to be changing. Most notably, WBMS has revised down its estimate for 2024 Chinese copper demand, replacing prior expectations of 2.5% growth with an outright decline of nearly 10%. The shift flips the market balance: copper, once presumed to be in deficit, now appears to be in surplus for the year-a more plausible explanation for the surge in exchange inventories.
We examine all of this in detail in the copper section of this letter, including our view of how these developments might shape the market as we move further into 2025.
Crude Oil
Oil prices moved without much conviction in the first quarter, caught between tightening fundamentals and indifferent investor sentiment. West Texas Intermediate slipped modestly, while Brent managed a gain just north of 1%-hardly the stuff of headlines. Energy equities, like the commodity itself, were mixed. The XLE ETF-dominated by large-cap integrated oil companies and often pressed into service as a funding vehicle in the modern-day carry trade-rose nearly 10%. The move was driven less by enthusiasm than by necessity: as technology stocks faltered, hedge funds and systematic traders were forced to unwind their short positions in XLE, which had become a convenient offset to their tech-heavy longs.
Beyond these household names, however, energy equities fared less well. The XOP ETF, which tracks the S&P Exploration and Production Index, was flat for the quarter. The Philadelphia Oil Service Index (OSX) fared worse, falling nearly 8%. Sentiment across the sector continues to be pessimistic. The energy sector’s weight in the S&P 500 is now back near its all-time low of 3%-a level last seen in the dark days of early 2020.
From a historical perspective, oil has seldom been cheaper relative to gold-a fact we explore more fully in the “Oil” section of this letter. And sentiment may be missing something far more consequential: a looming, underappreciated decline in non-OPEC supply.
We believe the stage is being set for a structural repeat of the 2003-2008 oil bull market. Then, as now, the market was gripped by bearish consensus. And then, as now, a quiet but critical shift was taking place beneath the surface. In the early 2000s, production from the North Sea and Mexico’s Cantarell field began to decline sharply-developments that caught most analysts off-guard. OPEC, in turn, seized both market share and pricing power. Oil prices rose nearly sixfold in five years.
Today, the U.S. shale patch-source of more than 80% of global non-OPEC supply growth over the last 15 years – is beginning to plateau, with signs of a broader rollover. And just as with the North Sea and Cantarell, the shift is going largely unnoticed. Outside the U.S., non-OPEC production has offered little to offset the trend.
Investor sentiment, meanwhile, borders on apathy-an apathy we believe has created a rare opportunity. For those willing to look beyond the momentary malaise, the setup in energy equities today may prove as compelling as it did two decades ago.
Uranium
Spot uranium prices softened modestly in the first quarter, easing from $74 per pound to $65. Term prices, however, remained firm-starting the year just above $80 and finishing in the same range. Far from signaling weakness, we view this as a healthy recalibration following an extraordinary multi-year run.
It’s worth remembering how far the market has come. Just four years ago, both spot and term uranium prices languished in the low $30 s, a forgotten corner of the commodity complex. By early 2024, spot prices had reached $106 per pound-driven there by a wave of capital from hedge funds and institutional investors who correctly recognized uranium’s compelling supply-demand dynamics. At the peak, spot traded nearly $30 above term-a clear sign of urgency in physical buying.
Today, that relationship has reversed. Term prices have continued to edge higher, rising $8 over the past 15 months. Spot, meanwhile, has pulled back nearly $40, now trading at a $15 discount to term. To us, this is not a sign of fundamental deterioration, but of a market in transition-shedding weak hands and speculative excess to prepare for the next leg higher.
In fact, the setup today may be even more attractive than it was in 2021 . The same speculative forces that once drove prices higher-hedge funds promoting the uranium super cycle are now working in reverse, attempting to press prices lower using the very tactics that sparked the 250% rally beginning in August 2021. But this time, fundamentals are far stronger, and the market is far tighter.
Supply remains structurally short. Utility demand continues to rise. Reactor restarts and new build announcements are accelerating. Yet sentiment has turned sharply negative-a perfect contrarian signal in our view.
We examine all of this in the “Uranium” section of this letter. There, we lay out why we believe the recent softness in spot is merely a pause-and why the long-term case for uranium remains among the most compelling in the entire commodity landscape.
Agriculture
Grain prices continued their drift lower in the first quarter, with corn and wheat each falling by more than 5% and soybeans slipping just 1%. Yet beneath the surface of these modest declines lies a market that may already have put in its bottom. Given the extreme levels of trader bearishness reached at multiple points last year, we believe the lows registered in the summer of 2024 likely marked the end of the grain bear market that began back in the second quarter of 2022.
In contrast to grain prices, fertilizer markets have quietly begun to rally-an early tell, in our view, of tightening conditions ahead. Urea and phosphate prices each rose 10% during the quarter, while potash surged 25%. From their lows last summer, urea is now up 50%, phosphate up 30%, and potash up 25%. These kinds of moves are rarely isolated.
Meanwhile, the supply backdrop for grains continues to tighten. As discussed in our last letter, corn and soybean ending stocks came in much smaller than initially forecast. With the 2025 northern hemisphere planting season now underway, the focus shifts squarely to weather-and here, too, the signals are turning more supportive for prices. All three of the world’s major grain-growing regions-the central U.S., Brazil, and the vast expanse stretching from Eastern Ukraine to Western Russia-are experiencing dry spring planting conditions.
In fact, both Brazil and Eastern Europe remain in the grip of extreme drought. And in the U.S., the dryness that began last fall has persisted into the critical early planting months. Last year, the USDA significantly lowered its 2024 crop yield estimates for both corn and soybeans due to similarly dry conditions. In response, the agency slashed 2024-2025 ending stock projections for both crops by nearly 30%.
Could we be setting up for a repeat? The early signs suggest it’s possible. With planting again beginning under notably dry conditions across the U.S. heartland, the probability of another disappointing yield season is rising.
We explore this possibility in depth in the Agricultural section of this letter, where we assess how a second consecutive weather-related shortfall could mark the true turning point for grain markets-and reignite the next leg higher in prices.
Coal
Coal prices parted ways geographically in the first quarter. In the United States, prices inched higher: Central Appalachian coal rose 4%, while Illinois Basin coal notched a 2% gain. But internationally, the story was starkly different. Thermal coal prices abroad weakened considerably. Newcastle prices-representing Australian coal largely bound for Japan and China fell 18%. Richard’s Bay, the South African benchmark supplying Asia and Europe, declined 14%.
Unsurprisingly, coal equities followed the global, not domestic, lead. The Dow Jones U.S. Coal Total Stock Market Index dropped a bruising 25%, mirroring the pullback in seaborne thermal coal.
The culprit was, by most accounts, China. A warmer-than-usual winter trimmed electricity demand, and with it, the need for coal-fired generation. Electricity produced from coal fell 4.7% year over year. To proponents of renewable energy, the numbers seemed to herald a long-awaited inflection point: the peak of China’s coal consumption, giving way at last to a renewables-led future.
We remain skeptical. As outlined in previous letters, the more a country leans into intermittent renewable energy, the more dependent it becomes on steady, base-load generation to backstop the system. The recent grid failure that blacked out large portions of Spain and Portugal may serve as a cautionary case in point.
In our view, the recent dip in Chinese coal demand owes more to transitory factors – weather and cyclical economic softness-than to structural change. All available data still point to another year of rising coal demand in 2025.
As for the equities: they’ve retreated sharply, much like the commodity itself. But history has a memory. Coal stocks, we’ve noted before, have often led the way in major commodity bull markets stretching back over a century. We see little reason to believe this time will be different. The recent pullback, in our view, presents investors with another compelling entry point.
Peak Shale Amid Maximum Pessimism
“In just 15 years, shale companies have increased U.S. oil production by about 8 million barrels of oil a day. The boom reduced the country’s reliance on foreign oil and saved American consumers billions of dollars via lower gasoline prices. But in recent years, signs that the era of shale dominance is coming to an end have multiplied.” Benoit Morenne, Wall Street Journal, May 17th 2025″We don’t have a crystal ball on the rest of the world, but we have a very good view of what the U.S. looks like, and right now, that’s a business that’s slowing dramatically and likely declining in terms of production.” Diamondback President Matthew Kaes Van’t Hof, CNBC May 6, 2025
The end of shale growth may well be the most consequential shift in global oil markets in a generation. For years now, we have outlined with what we hoped was clarity, and what we now submit was prescience, the view that U.S. shale oil, that great source of modern supply, could not grow forever. It would mature, crest, and begin its long descent. That moment, by our models and measures, has arrived: shale has plateaued, and 2024 appears to be its high-water mark. And yet, investor sentiment has scarcely been more downbeat.
Investor pessimism today rests largely on two factors: first, the economic uncertainty stirred by the Trump administration’s tariff policies; and second, the recent OPEC+ decision to begin unwinding its voluntary production cuts, which date back to the early pandemic period. Taken together, these developments have revived an old anxiety-that supply will once again exceed demand, inventories will rise, and prices will weaken.
We do not share this view.
As of April 8th, the Commitment of Traders report showed that speculative net long positions in WTI crude stood at just 139,000 contracts-near the lowest levels seen since 2012. It is a posture of caution, not conviction, and suggests that much of the market has already priced in the prevailing fears.
Equity investors, for their part, have shown no greater enthusiasm. Since the start of 2024, shares outstanding in the S&P Exploration and Production ETF (XOP) have declined by 52%. The longer view tells a similar story: since October 2020, the number of shares has fallen by 68%, even as the fund has delivered annualized returns of 30%-twice the pace of the S&P 500. And yet, despite this standout performance, total fund assets in the XOP have barely budged over the past five years. Few other corners of the equity market have produced so much and received so little in return.
This lingering caution has not remained confined to the equities. Investor reluctance has weighed heavily on crude itself. Adjusted for inflation, West Texas Intermediate (WTI) ended April below the depths of the Global Financial Crisis and at parity with the February 2016 trough. Since 2002, only once-April 2020, in the nadir of the COVID collapse have real oil prices been meaningfully lower. These levels have often marked key turning points over the last two decades, with prices typically finding their footing and moving higher thereafter.
FIGURE 3 Commitment of Traders – Speculator WTI Net Length
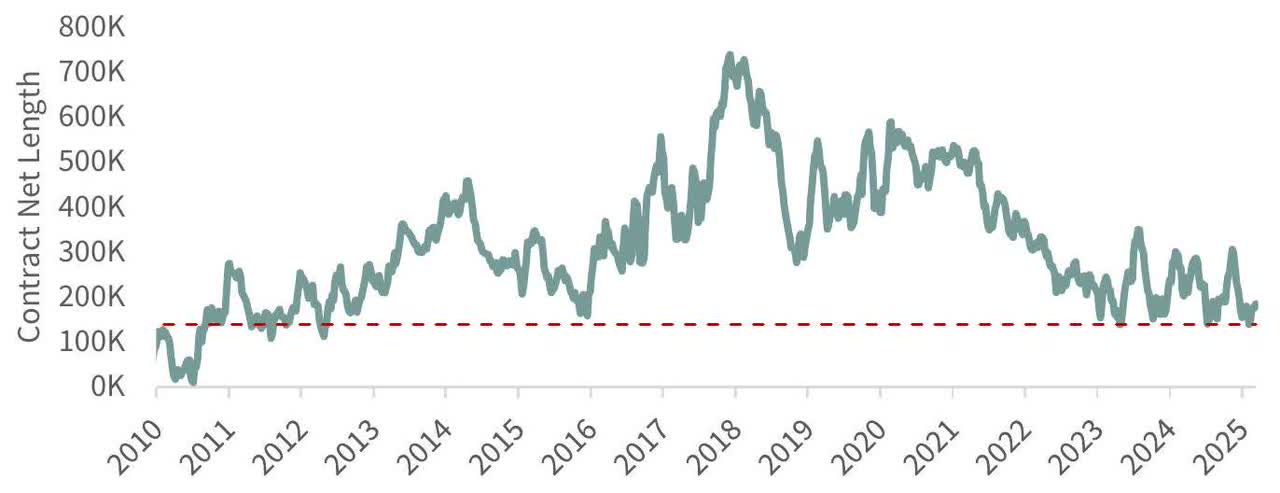
Source: Bloomberg. By another measure-one less often cited but deeply revealing-oil has rarely looked cheaper. At the end of April, a single ounce of gold could buy 56 barrels of crude, the second-highest reading on record. For context, over the past 35 years, the gold-to-oil ratio has averaged 17 barrels per ounce and has remained below 25 nearly 85% of the time. Even during the market chaos of March 2020, when COVID lockdowns brought demand to a standstill, the ratio only just crossed 40 barrels. It would briefly surge to 90 the following month, but that spike, like the moment itself, was fleeting.
FIGURE 4 Real WTI Oil Price (Year 2020 USD)
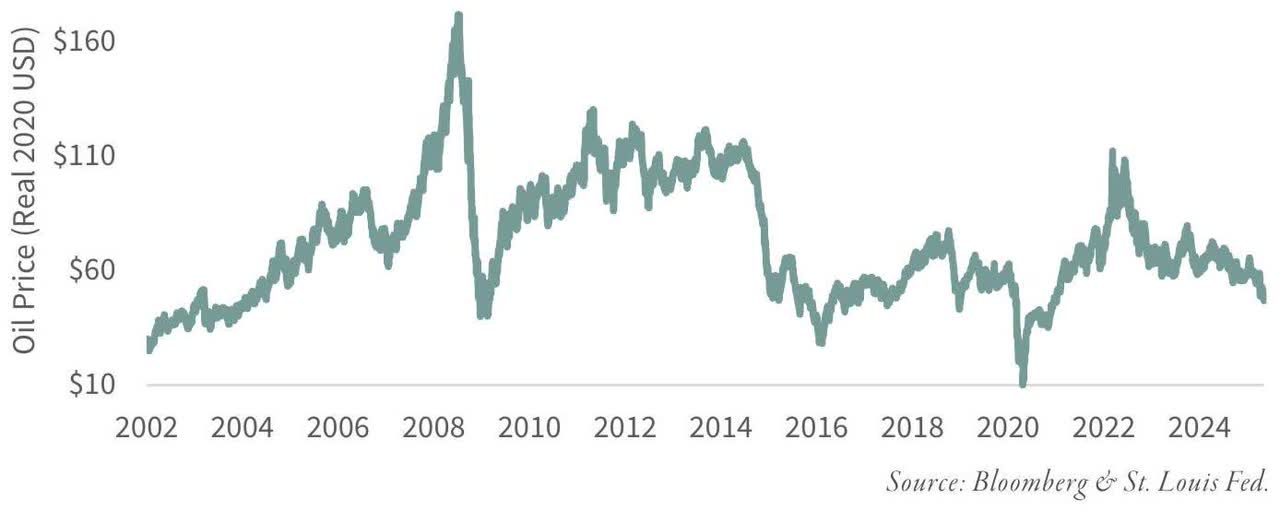
The implications are more than academic. Since 1990, the median forward 12-month return for spot WTI crude has been about 4%. But when oil has traded at these kinds of relative discounts-when an ounce of gold buys more than 25 barrels-that median return has jumped to 30%. Conversely, when the ratio has dipped below 20, WTI’s forward performance has tended to be negative. In other words, when oil is this cheap, history suggests it rarely stays that way for long.
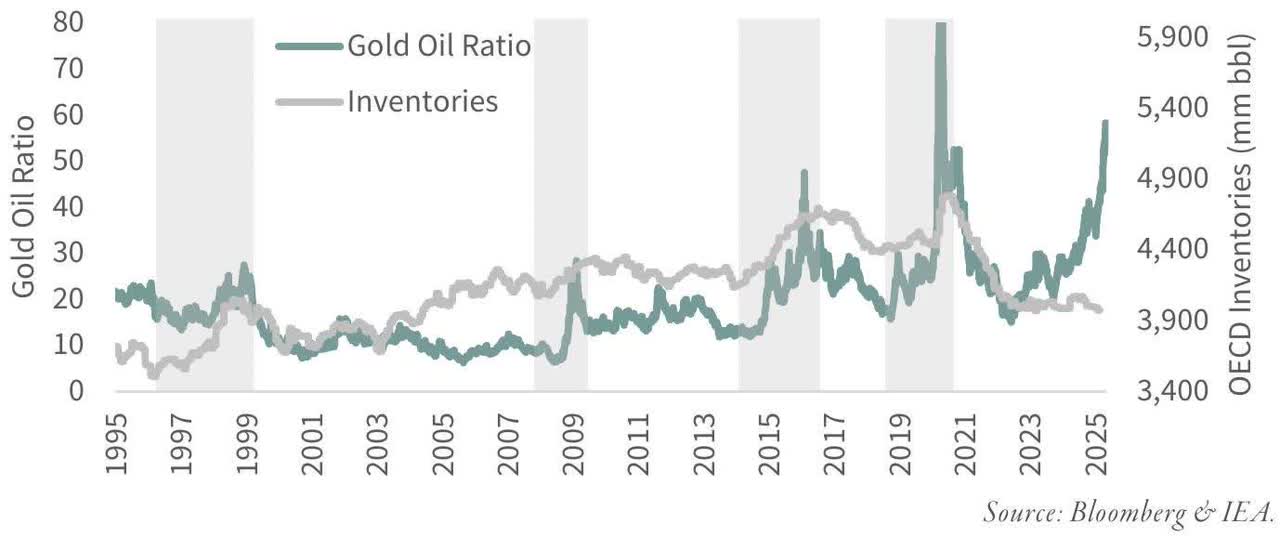
Historically, such steep discounts in oil-whether measured in real dollars or relative to gold-have coincided with obvious imbalances: too much crude sloshing around, and nowhere to put it. Sharp moves higher in the gold-oil ratio have tended to coincide with rising OECD petroleum inventories, the industry’s clearest signal of oversupply. Sell-offs, too, have typically occurred when inventories were not just rising but already flush, providing a comfortable cushion should demand return.
F I G U R E 5 Gold – Oil Ratio
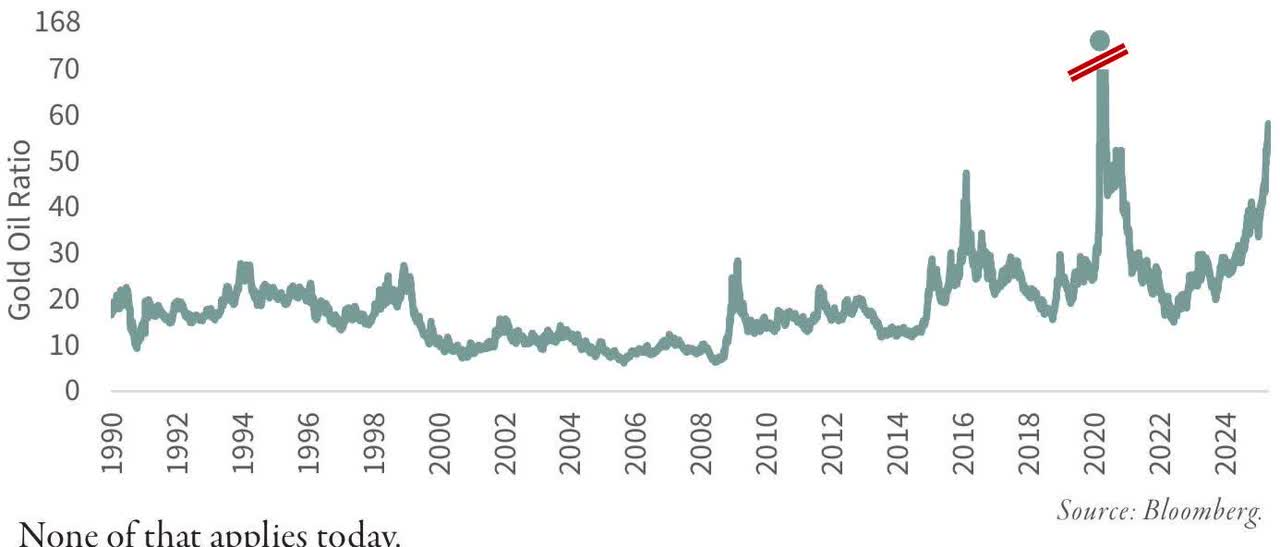
None of that applies today.
Since bottoming in June 2022, the gold-oil ratio has climbed from 15 to 58-nearly a fourfold increase. And yet, rather than swelling, inventories have steadily declined. Petroleum stocks across OECD countries are now at their lowest levels in more than two decades. If this market is in surplus, it is hiding it unusually well. More likely, the deficit persists, quietly but persistently, even as prices and sentiment suggest otherwise.
Unlike in previous sell-offs, today’s oil price appears to have skipped past uncertainty and gone straight to conviction-pricing in, with unnerving resolve, the worst-case scenario. For market fundamentals to truly justify current levels, conditions would have to deteriorate swiftly and severely from here. Should that come to pass, it would be among the rare instances when the consensus-so often late, so frequently wrong-is proved entirely correct.
We would not count on it.
More likely, the recent retreat in prices reflects not foresight, but fatigue-a market grown weary, not wise. And if history is any guide, such periods of deep pessimism have often preceded handsome returns for those with the temerity to doubt received wisdom.
FIGURE 6 Gold – Oil Ratio & OECD Inventories
What makes this moment especially striking is that, just as sentiment has reached its lowest ebb in years, the most consequential bullish development in over a decade has quietly taken root: U.S. shale oil production, after years of relentless ascent, appears at last to have turned.
The scale of shale’s contribution is difficult to overstate. Since 2010, nine out of every ten barrels added to global liquids consumption have been met from U.S. shale fields – whether as crude or natural gas liquids. It has not merely participated in the oil market; it has defined it. For more than a decade, the world’s marginal barrel has been a shale barrel, drilled and fracked somewhere between the Permian, Bakken or Eagle Ford. That era, it seems, is drawing to a close.
History offers only two precedents for what may now be unfolding-and both came with consequences as spectacular as they were enduring. On each occasion, the engine of global production growth began to sputter, and in each case, oil prices responded not with modest recalibration, but with a near tenfold surge from their lows.
The first such episode came in the 1970s, when U.S. conventional oil production-after decades of dependable expansion-finally crested and began to decline. It happened, uncannily, just as Shell geologist M. King Hubbert had forecast in 1956. Production peaked at just over 11 million barrels per day in 1970, a figure that, at the time, represented nearly 45% of all non-OPEC supply. The effects were immediate and far-reaching. Non-OPEC output growth, which had averaged 1.5 million barrels per day annually between 1965 and 1970, slowed to under 900,000 barrels a year over the next half-decade.
Into the gap stepped OPEC. With greater market share came greater leverage, and the cartel exercised it twice in the 1970s by cutting off supply to the West. Prices responded in kind. Crude, which had traded at $1.80 per barrel in 1970, reached $11.53 by 1975, before ultimately peaking at nearly $37 in 1980 .
The surge in oil prices during the 1970s triggered a wave of exploration and development across non-OPEC frontiers, unleashing a capital flood that would ultimately bring forth the great offshore provinces of the North Sea and Mexico’s Cantarell field. These new giants shifted the balance once again. Supply flooded in, and with it came the inevitable consequence: prices sagged. Over the next two decades, as production from these new basins ramped higher, oil prices sank lower, until by 1998, WTI bottomed out at a modest $10.72 per barrel.
But the cycle, once again, turned.
By the early 2000s, both the North Sea and Cantarell-those great sources of non-OPEC supply growth-began to falter. By 2003, both fields had reached peak output, and once again, the pace of non-OPEC production growth slackened. Prices, which had been quietly recovering since the late 1990s, began to stir with more purpose. From their 1998 lows, WTI crept up to $25 by 2003 . But it was the years that followed that truly captured the arc of history: as non-OPEC growth slowed, OPEC’s share and pricing power rose once again, until, by 2008, WTI touched $145-a 13-fold increase over a single decade.
It was neither widely anticipated nor, even now, widely remembered for what it was: a supply story, plain and simple. But we took notice. In 2003, Barron’s published an interview in which we laid out just this view-that the disappointment brewing in non-OPEC supply would prove far more meaningful than investors then understood.
In the late 2000s, the U.S. shale revolution began in earnest-first as a curiosity, then as a juggernaut. Once again, non-OPEC production surged, and once again, the narrative of boundless supply took hold. But for all its novelty and technological sheen, the shale boom shares more than a passing resemblance to prior episodes in the oil market’s long history. It echoes, in its shape and trajectory, U.S. conventional production in the 1970s and the offshore giants of the 2000s. And if history is any guide-and in the oil patch, it so often is-the result is likely to be familiar as well: a sharp turn upward in prices in the years ahead.
We came to shale early, and stayed close. Over the past 15 years, we have studied the industry not just broadly, but intimately-well by well, basin by basin. In 2019, with much of the investment community still treating shale as inexhaustible, we began to warn that the boom was likely to crest by 2024-far earlier than conventional wisdom allowed.
FIGURE 7 Pumped Up
Source: Barrons.
Our view was not built on hunches or heuristics, but on the back of proprietary neural networks we developed specifically to track changes in drilling productivity. The results were striking. They suggested that what had been heralded as relentless technological advancement was, in fact, something more fragile: high-grading. A familiar term in the mining business, high-grading refers to the tendency to focus on the richest portions of a deposit first-yielding strong initial gains, followed by inevitable and often irreversible declines. Shale, it seemed, was again following the same script.
At our investor day last October, we presented a fresh cut of our data. It suggested that U.S. shale production was on the cusp of its long-anticipated peak. That moment, it now appears, has arrived.
According to the latest figures from the Energy Information Agency (EIA), shale oil production reached its sequential high in November 2024, at 9.17 million barrels per day. Since then, the trend has flattened, and the pace of growth has begun to falter. While output remains modestly higher than a year ago, the gain-just 250,000 barrels per day as of April 2025-is the weakest annual increase outside of two exceptional events: the COVID-19 lockdowns, and the Saudi-led price collapse of 2014-2016.
The era of shale-led surges-those 1.5 million barrel-per-day annual romps-has ended. What lies ahead is less familiar, but no less consequential: a slow, likely inexorable decline.
Until quite recently, ours was a lonely view. In its 2023 Short Term Energy Outlook, the Energy Information Administration projected that U.S. oil production wouldn’t crest until 2030-and even then, the plateau would be long and uneventful. From the summit of 2030 to the horizon of 2050, the EIA foresaw production declining by a mere 100,000 barrels per day-a rounding error, really, in a market that reaches well over one hundred million barrels per day.
But the mood, and the math, are beginning to shift.
In its most recent update, the EIA has quietly but meaningfully revised its outlook. The projected peak has moved up three years to 2027, and the descent that follows is no longer a gentle slope but a marked decline: by 2050, production is now expected to be 20% below the projected peak. The change in tone is as striking as the numbers themselves.
The International Energy Agency, for its part, has also moved. In its latest Oil Market Report, the IEA now calls for U.S. production to top out in 2026-a notable pivot from years of forecasts built on the assumption of near-continuous growth.
Our own models agree with the direction of travel, though we believe the inflection point is not some future abstraction-it is already behind us.
The view, once fringe, is fast becoming mainstream. At this year’s CERAWeek-long the industry’s premier gathering of minds and money-some of the most senior voices in U.S. energy said the quiet part out loud. Scott Sheffield, the former CEO of Pioneer Natural Resources, made no effort to conceal the logic behind last year’s $70 billion sale to ExxonMobil: the company was running out of high-quality drilling inventory. Vicki Hollub, CEO of Occidental Petroleum, echoed the concern. And in his most recent quarterly remarks, Travis Stice of Diamondback Energy said plainly what the numbers already suggest-that U.S. production has likely rolled over and is headed lower from here.
The press, traditionally slow to challenge the consensus in oil, is beginning to catch up. Benoit Morenne of the Wall Street Journal, one of the few reporters who has consistently dug into the underlying shifts in the shale patch, published a piece on May 17th with a headline that needs little elaboration: “U.S. Drillers Say Peak Shale Has Arrived.” We’ve spoken with him often over the years, and the story he tells is a sober – but, we believe, accurate — one.
Investors would be wise to listen.
Some have tried to pin the blame for declining U.S. production on low oil prices – a familiar refrain in a cyclical industry. But in our view, the cause runs far deeper. What we are witnessing is not a temporary slowdown driven by market signals, but something more enduring: geological exhaustion.
Our neural networks first raised the alarm in 2019, well before it was fashionable-or comfortable-to do so. They suggested that, at prevailing drilling rates, the most productive parts of America’s shale basins would be largely exhausted by 2025, if not sooner. The data have since borne that out. Shortly after our initial warning, well productivity-measured by initial production per lateral foot-peaked and began to decline. Nowhere is this more evident than in the Permian Basin, which has quietly shouldered the burden of nearly all shale growth in recent years.
But even the Permian has its limits. Since June 2021, initial production per foot has fallen by more than 15%, and the trend shows no signs of abating. As the core acreage grows ever more drilled out, productivity will almost certainly fall further. And as any long-time student of the oil patch knows, when a field begins to decline for geological reasons, no amount of capital or technology can restore it to growth.
Based on current rig counts, our models suggest that Permian production could fall by as much as 400,000 barrels per day by year-end. That’s not a small dip, bur rather a meaningful shift in the global supply picture.
It is also, we would note, no accident that the current administration, once a vocal proponent of energy independence, now finds itself urging OPEC+ to open the taps. “Drill, baby, drill” may have made for an effective slogan-but geology, stubborn as ever, has had the final word.
How, then, to explain investor pessimism at a moment when supply-side developments by any rational metric-ought to be stirring optimism? The answer, as we’ve suggested, lies in a familiar brew of macroeconomic anxiety and more oil from OPEC+ than markets had penciled in.
At the heart of the unease is the Trump administration’s latest attempt at global economic theater: the so-called “Liberation Day” tariffs, announced on April 2nd. Bold in branding, uncertain in execution, the policy has introduced no small measure of confusion into markets already struggling to make sense of their surroundings. Matters were hardly helped when the White House, with characteristic suddenness, reversed course and announced a ninety-day reprieve on April 11th. Rather than clarify the landscape, the move deepened the fog, leaving investors more perplexed about the future than before the announcement.
To be sure, the range of plausible demand outcomes has widened-no quarrel there. But we would gently suggest that oil market participants have veered too far into gloom. The reason is deceptively simple: the starting point for demand today is far higher than most believe. Which means that any future decline-should one materialize-will be falling from a height, not a trough. That altitude, often overlooked, is what could make all the difference.
Consider, by way of illustration, the chain of events that followed the administration’s tariff salvo. Practically overnight, the International Energy Agency trimmed its full-year 2025 oil demand forecast by 400,000 barrels per day-a tidy figure and one that sent prices tumbling in predictable fashion. But buried in the same April dispatch was something rather more curious: nearly three years’ worth of so-called “missing oil,” averaging a comparable 400,000 barrels per day.
Seasoned readers will recognize our long-standing fascination with these “missing” barrels quantities that, according to the IEA’s own numbers, have been produced yet have neither been consumed nor sequestered in inventory. For us, they have always been more than an accounting oddity. They are signals suggesting that prior estimates of global demand have been understated and need revision.
Sure enough, one month later, the IEA issued its May report, and with it came a sweeping reconciliation. Most of the mysterious “missing” barrels were accounted for-not by lowering production, mind you, but by lifting past demand. Their estimates for 2022, 2023, and 2024 were revised up by 300,000 barrels per day. And as if to close the loop with mathematical elegance, their projection for this year’s demand was also bumped higher-by 400,000 barrels per day, the same number that had earlier sent markets into a tizzy.
The upshot? Expectations for 2025 oil demand are now precisely where they stood at the year’s outset. The feared drop due to trade tremors was neatly counterbalanced by a quiet acknowledgment: we had been starting from a far stronger base than we thought. In sum, the net effect on balances was zero, though you would never have known it from the market’s reaction.
Still, we find ourselves suspecting that even now, the IEA has not gone far enough. Their revisions, however welcome, appear only to scratch the surface. Take the first quarter of 2025: the balancing item ran at an eye-catching 1 mm barrels per day, among the highest on record. If, as we’ve long contended, these “missing” barrels are merely the shadow cast by uncounted demand, then global consumption during the first three months of the year clocked in at a robust 103.5 million barrels per day. That’s nearly 2 million barrels per day higher than the same stretch last year-a rate of growth that stands as one of the most vigorous in recent memory.
Of course, we are not blind to the potential consequences of tariff-induced hesitation or the ambient uncertainty now clouding boardrooms and trading desks. But what seems to elude the consensus view is just how much strength was already baked into the system before the first tremors of trade anxiety began to ripple outward. This momentum, we believe, offers a considerable cushion-an economic buttress-against demand shocks that may lie ahead.
Yet curiously, and somewhat disconcertingly, a prevailing narrative has taken hold suggesting that oil demand is currently anemic. We search for the data to support such claims and find ourselves coming up short. The numbers, as they stand, suggest the opposite: a market that entered this moment of policy drama not in a state of decline, but of undeniable strength .
The other matter preoccupying the investor mind these days concerns OPEC, which never one to be left out of the global spotlight-delivered a surprise of its own. In March, the cartel announced it would begin unwinding its voluntary production cuts, raising targets by 138,000 barrels per day beginning in April. That, in itself, might have been absorbed with relative calm. But what followed bore all the hallmarks of a coordinated performance. Just as the Trump administration was rolling out its tariff policy with suitable fanfare, OPEC declared yet another production bump-this time to the tune of 411,000 barrels per day for May. Then, in early May, another increase came through for June, roughly matching the last in size and in strategic timing.
Some analysts interpreted the moves as evidence of internal discord-a breakdown in the notoriously delicate consensus that binds the OPEC+ alliance. We, however, suspect a simpler explanation. The clue lies, as it often does, in the choreography. The revisions arrived hand-in-glove with Washington’s tariff theatrics. We would wager that OPEC’s apparent magnanimity had more to do with domestic American politics than cartel squabbling. Lower gasoline prices, after all, remain a cherished promise of the current administration, and it’s no great leap to imagine that a few well-timed gestures from Riyadh were designed to help keep that promise alive-just in time for the next news cycle.
As ever, the devil-as the saying goes-is in the details. While the OPEC+ production targets are slated to rise by a headline-grabbing 825,000 barrels per day relative to April’s levels, the actual barrels that make their way to market may tell a more modest story. Here’s why: of the countries bound by the bloc’s quota system-eight in total-several have been playing fast and loose with the numbers. Though the group’s official April target stood at 30.3 million barrels per day, actual production clocked in at a more generous 31.8 million. The usual suspects-namely Iraq, the UAE, Russia, and Kazakhstan-accounted for most of the overage.
Now, with quotas being formally raised by 825,000 barrels, the question becomes: are we witnessing an actual increase in supply, or merely a formalization of what was already happening? In our view, the answer is likely a blend of both. Yes, production may rise-but not by nearly as much as the revised targets might suggest. And thus far, the early data seem to support this hypothesis. April output from the eight quota-bound countries was actually 100,000 barrels per day lower than in March-this despite the first step-up in targets.
Add to that a few additional wrinkles. Pressure from the White House for Chevron and others to wind down operations in Venezuela threatens to undercut production there. And after three years of restricted access to Western oilfield expertise, Russia’s ability to sustain, let alone grow, its production remains decidedly uncertain. In short, the market may not be getting all the barrels it thinks it is-and certainly not all at once.
Taken together, we believe these developments leave the global crude markets considerably tighter than is generally understood–for the balance of 2025, and perhaps beyond. The International Energy Agency, ever dutiful in its forecasting, currently envisions a market surplus of 700,000 barrels per day for the remainder of the year. We are less convinced. Our reading of the tea leaves-and, more to the point, of the numbers-suggests the market is in fact balanced, and may already be tipping toward a mild deficit.
It’s worth remembering that the IEA had previously characterized the first quarter as oversupplied by 800,000 barrels per day. Their tally: demand averaging 102.5 million barrels per day against a supply of 103.4 million. But with the OECD’s inventory data now fully in, that supposed surplus has vanished. Inventories, as it turns out, drew down by 200,000 barrels per day-perfectly in line with seasonal norms. In other words, the quarter was not awash in oil. It was, by all indications, perfectly balanced.
Looking ahead, the IEA expects non-OPEC+ production to expand by 1.3 million barrels per day in 2025-a notable shift, as most of that growth is finally projected to come from outside the United States. Even so, the U.S. is still expected to add 400,000 barrels per day. Overlaying OPEC+ growth of another 500,000 barrels, the global supply ledger would rise by 1.8 million barrels per day to reach 104.8 million. Demand, by comparison, is expected to increase by just 700,000 barrels, landing at 103.9 million.
But this tidy equation leaves out the balancing item-the infamous “missing barrels” that averaged 1 million per day in the first quarter. If that phantom demand persists, real consumption could be as high as 104.9 million barrels per day-leaving the market in outright deficit.
And even this may be optimistic. Our own models suggest that U.S. production growth may not reach the projected 400,000 barrels, but instead come in closer to 200,000 . Non-OPEC+ production elsewhere may also fall short. In such a case, even if the balancing item dwindles to half its recent average, the global market would still come out flat, if not outright tight.
Investors, it seems, are bracing for the worst. In their collective imagination, the oil market stands on the verge of collapse, its future dimmed by trade tensions, economic uncertainty, and the ghost of recessions past. And yet, the actual fundamentals-those stubborn, unglamorous facts-tell a far less dramatic story. If anything, the road ahead appears balanced, even precariously tight, with every likelihood of slipping into deficit as the year unfolds.
To be clear, we do not dismiss the rising economic anxieties of recent weeks. But it is essential to remember that any weakening of demand will be unfolding from a far more robust starting point than most appreciate. And while the headlines flutter with speculation and policy drama, a more momentous shift has quietly taken hold: the great boom of U.S. shale the engine that has defined a decade of global oil dynamics-is now in unmistakable decline.
Against this backdrop, one must ask: does the current price of oil, when adjusted for inflation, deserve to languish near levels last seen at the nadir of the Global Financial Crisis? Or, expressed in gold, does it make sense that crude is now trading at its second-lowest reading on record? We think not.
Rather, we suspect that oil may emerge-unexpectedly and unceremoniously as one of 2025’s most surprising victors.
Gold Rises, Equities Sleep
The 19 percent rise in gold prices was supported by the return of the Western investor. After selling 15 tonnes of gold in the fourth quarter-prompted by a sharp surge in the U.S. dollar-Western buyers returned in force in the first quarter as the dollar’s 10 percent gain was fully reversed. The 18 physical gold ETFs we track accumulated 160 tonnes during the quarter. Notably, the silver market followed a similar pattern. The eight physical silver ETFs we monitor, which had sold 85 tonnes in the fourth quarter, came back as buyers, adding approximately 110 tonnes in the first quarter.
President Trump’s push for a global trade war, coupled with his public pressure on the Federal Reserve to lower short-term interest rates, points to further weakness in the dollar as we move through 2025. That in turn is likely to sustain Western interest in physical gold. Indeed, investor demand has remained strong into the second quarter: in April alone, the 18 physical gold ETFs we track added another 30 tonnes.
Physical gold ETFs have also gained traction in China over the past several years, emerging as a popular investment vehicle-and one that continues to grow in appeal. In its “Gold Demand Trends” report for the fourth quarter of 2024, the World Gold Council estimated that Chinese demand for gold coins and bars totaled approximately 86 tonnes, while physical gold ETF holdings rose by 74 tonnes. In the first quarter of this year, the Council estimated that coin and bar demand in China fell to 14 tonnes, whereas physical gold ETFs added 34 tonnes to their holdings. With this rising popularity, we believe these ETFs now serve as a useful barometer of gold demand trends in mainland China, and we plan to track and comment on their activity in future letters.
Central banks, too, remain significant buyers of gold, motivated in part by the uncertainty stemming from ongoing trade disputes. According to World Gold Council data, central banks purchased 244 tonnes of gold in the first quarter. While this represents a 20 percent decline from the first quarter of 2024, overall demand remains strong. As in recent quarters, Poland continues to be the standout buyer, adding 49 tonnes during the period. The Polish central bank has stated its intention to raise gold holdings to 20 percent of total reserves-a goal it now appears to have reached. Whether Poland will continue accumulating gold beyond that target is unclear; the central bank has not provided any recent guidance. For now, one of the larger sources of official sector demand may be on pause.
Also notable was continued gold buying by the People’s Bank of China (PBOC), which added 13 tonnes during the quarter. High prices had kept the PBOC largely on the sidelines through the first nine months of 2024, but the latest data suggest that China has reentered the gold market in a sustained way, despite significantly higher price levels. The PBOC has now increased its gold reserves for five consecutive months. Even so, gold accounts for just 6.5 percent of China’s total reserves-a relatively low figure by global standards.
India, too, returned to the market with a purchase of 3 tonnes in the quarter. We continue to believe that BRIC nations may eventually conduct trade with China in renminbi, with trade-related imbalances settled in gold. Brazil, for its part, has already announced plans to settle all of its commodity exports to China in renminbi. India’s recent activity lends further weight to the possibility of a shift in the global monetary system along these lines-one that, we believe, still holds merit.
The disruptions brought on by President Trump’s trade wars, along with growing speculation around a broader realignment of the global monetary system-perhaps even in the direction suggested by the so-called “Mar-a-Lago accords” rumors-are likely to keep central banks active in the gold market. We expect that central bank purchases will remain strong through the remainder of 2025.
One of the more curious data points that continues to hold our attention is the near-total absence of Western investor interest in gold mining shares. We watch closely the number of shares outstanding in the GDX ETF-the largest and most liquid vehicle for gold equities and the trend has been unmistakable. Despite the strong performance of gold over the past 18 months, and despite gold equities having dramatically outperformed the major equity indices-for instance, while the S&P 500 and NASDAQ 100, with their heavy concentration in large-cap growth stocks, have risen approximately 20 percent, the GDX has returned 60 percent-interest in gold shares has not just failed to keep pace, it has declined. Since peaking in March of last year-coinciding with gold’s breakout to the upside-the number of shares outstanding in the GDX has dropped by nearly 30 percent, with the decline only accelerating. As the chart below illustrates, the reduction in GDX shares outstanding has been both steady and sharp.
Were gold equities seeing renewed popularity and the number of shares outstanding in the GDX surging, one could make the case that a large portion of the gold bull market had already been played out. But the opposite is true. The prevailing disinterest in gold mining shares leads us to conclude that this bull market in gold has barely begun to register among Western investors. That same lack of enthusiasm-resulting in valuations we believe are among the lowest ever observed-supports our conviction that the current uptrend in gold still has years to run. For further context, we refer readers to our essay, “Gold Stocks Have Never Been Cheaper,” which appeared in our second-quarter 2024 letter.
When this cycle nears its end, and profits should be taken, we expect to see a very different picture: the number of GDX shares will be exploding higher, and gold equities will be widely embraced as a “must-own” asset class. That moment, we believe, is still well down the road.
FIGURE 8 GDX Shares Outstanding
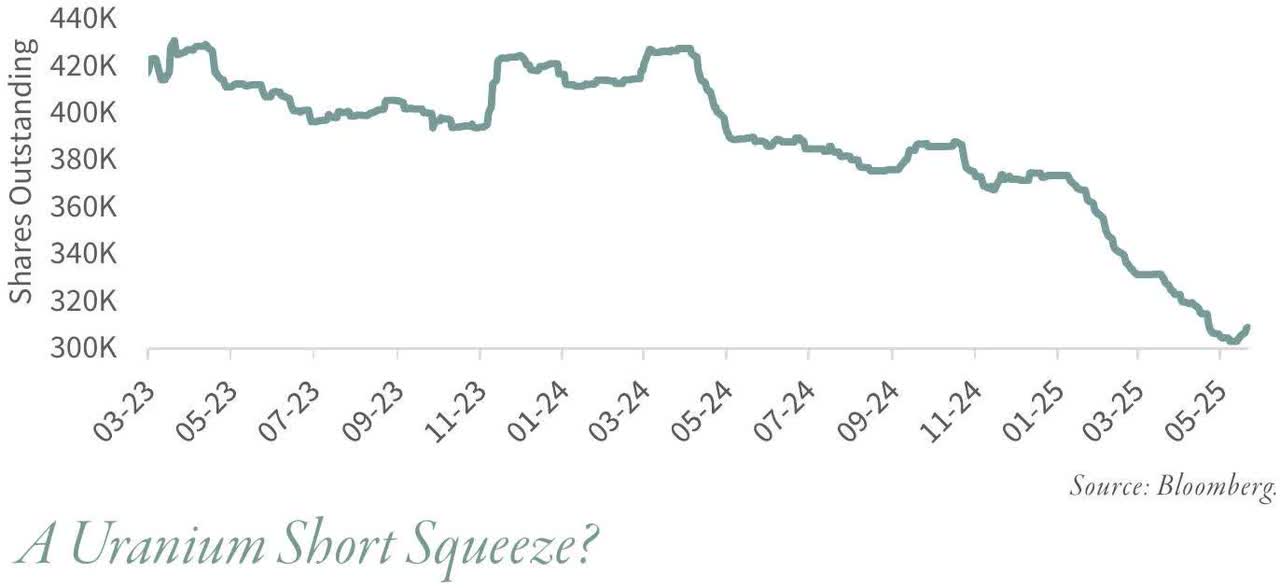
A Uranium Short Squeeze?
Back in 2018, we posited that financial players-ever alert to overlooked corners of the commodity world-would emerge as a dominant force in uranium pricing as the bull market unfolded. In an essay titled “New Sources of Demand Tighten the Market,” we described the early signs: institutional capital, formerly a spectator, had begun to wade directly into the physical uranium trade. “Since we last wrote,” we noted at the time, “another source of unexpected physical demand has entered the market-one that we believe could become substantial as the bull market unfolds.” The then-obscure Uranium Participation Corporation, a closed-end trust that quietly held physical uranium, had suddenly become a favored vehicle for these new financial actors. Two more closed-end funds followed soon after, expressly designed to meet this burgeoning appetite. In subsequent podcasts, we remarked-perhaps with less surprise than resignation-that it would not be long before hedge funds, armed with capital and creativity, discovered ways to influence the uranium spot market through these very instruments.
A typical hedge fund maneuver unfolded along the following lines: First, assemble a portfolio of uranium equities – names poised to benefit from a rising spot price. Next, acquire a sizable position in the Uranium Participation Corporation-later rechristened the Sprott Physical Uranium Trust (OTCPK:SRUUF)-and bid its market price to a premium over its underlying net asset value. At that point, the trust would issue new shares in order to realign its price with NAV. The proceeds from that issuance would then be deployed to purchase physical uranium, exerting upward pressure on the spot price-thereby boosting the very equities that initiated the trade. It was a circular, elegant bit of financial choreography, and it gained widespread favor following Sprott Asset Management’s acquisition of the old Uranium Participation Corp in July of 2021.
Sprott made no secret of its ambition: one of the Trust’s stated purposes was to tighten the uranium market by accumulating the remaining surplus of physical material still held by utilities and traders-stockpiles that had lingered since the aftermath of Fukushima. Whenever the Trust’s shares traded at a premium to net asset value, it would promptly issue new stock, deploying the proceeds to acquire as much physical uranium as the market would yield. In hindsight, Sprott’s campaign was remarkably effective.
In July 2021, when Sprott assumed control of the Trust, uranium traded at $32 per pound and the vehicle held 18.2 million pounds of the metal. Just two and a half years later, the Trust’s holdings had swelled to 63 million pounds, and the spot price had surged to $106. Hedge funds and other speculative players had succeeded not only in cornering a meaningful portion of the uranium market-but in crafting a compelling bullish narrative, amplified through their buying stewardship of the Sprott Physical Uranium Trust.
Still, when hedge funds speak in unison-particularly in commodities-prudence suggests one should begin looking for the exit door. By late 2023, sentiment among speculative players had grown euphoric, and in hindsight, it served as a textbook warning. Uranium prices peaked in January 2024 at $106 per pound-nearly a sixfold increase from the lows of 2017. And though the structural fundamentals for uranium remain increasingly favorable, the market was due-indeed, overdue-for a correction.
Since peaking over a year ago, spot uranium prices have retreated by roughly 35%-a move well within the bounds of a healthy correction in the context of a long-term bull market. What has proven far more intriguing, however, is the remarkable shift in hedge fund sentiment. Having embraced the trade with near-religious fervor at the top-just over a year ago-many of these same funds have now adopted an equally zealous bearish stance. Where once the Sprott Physical Uranium Trust was the lever by which they sought to elevate the uranium price, it is now being employed as an instrument to press it down-along with the equities influenced by it.
This reversal was, candidly, not one we anticipated. As noted, the underlying fundamentals in global uranium markets have only improved over the past eighteen months. That hedge funds-having entered late into the bullish trade of 2023-would so quickly and forcefully reverse their positioning, and turn bearish, was not a scenario we had foreseen.
And yet, here we are. The Sprott Trust, so recently a symbol of speculative optimism, is now a vehicle for propagating pessimism. From our perspective, the resulting dislocation presents investors with a rare and compelling opportunity-especially in uranium equities. Hedge funds have built substantial short positions in a number of developers, particularly those advancing projects in Australia. We remain confident that the uranium bull market is far from over, and that the sharp pullback in the equities-engineered, in part, by short-selling hedge funds-has created a moment of genuine opportunity for the long-term investor.
On the way up, hedge funds were among the most enthusiastic buyers of the Sprott Physical Uranium Trust, bidding its shares to a premium over net asset value. Today, the same funds are sellers-and, in many cases, short sellers-driving the Trust to a pronounced discount. As of this writing, the Trust trades at a 10% discount to its stated NAV.
This discount carries several bearish implications, particularly in the near term. Most notably, the Trust is effectively barred from issuing new shares-its principal mechanism for raising capital to acquire additional physical uranium. Since uranium prices peaked in the first quarter of 2024, the Trust has consistently traded below NAV, rendering it unable to participate meaningfully in the spot market. Over the past twelve months, reflecting this structural constraint, the Trust has issued very little new equity and acquired only 3 million additional pounds of uranium.
With hedge funds now broadly positioned on the short side of the uranium trade, their incentives have inverted. Keeping the Trust below NAV has become tactically advantageous, and persistent rumors suggest that whenever the Trust’s price drifts near par, aggressive selling resumes. In the absence of the Trust’s steady bid, the spot market has softened-and prices have declined by 35% over the past 14 months.
A glance at the spot price alone might tempt a speculator into declaring the uranium bull market dead and buried – that a new bear market has begun. But a deeper look, particularly at the term market, tells a different story. As we noted in our First Quarter Natural Resources Commentary, while spot prices have declined by 35%, term prices have continued their ascent and now sit 8% higher than they were at the spot peak in January. With the Sprott Physical Uranium Trust sidelined, hedge funds have seized the opportunity to craft and sustain a bearish uranium narrative. Just as they once drove spot prices upward using the Trust as their preferred lever, they are now employing it to push prices downward-once again making it their instrument of choice.
There is, however, an additional wrinkle to the current hedge fund strategy. The Sprott Trust has an estimated annual operating cash burn of roughly $20 million. At present, it holds only about $7 million in cash. Hedge funds are circulating rumors that the Trust will soon run dry and be forced to sell physical uranium from its holdings to meet its operating costs. While the Trust has publicly stated it has no intention of selling uranium under any circumstances, hedge funds counter that financial necessity may soon override principle. The fear, they suggest, is that even a single sale would shatter the Trust’s credibility-and open the door to future liquidations at any time. Whether true or not, the mere specter of such a scenario has added a heavy layer of uncertainty to an already fragile market.
Using this narrative, hedge funds have amassed large short positions in a range of junior uranium equities-particularly in Australia. In several instances, short interest has reached a staggering 35%, despite the fact that these companies carry no debt. The scale of the bearish wager is striking, and it brings to mind another moment in commodity investing history: when hedge funds piled into short positions on natural gas producers like Range Resources (RRC) and Antero (AR), citing high leverage and low prices as harbingers of bankruptcy. We disagreed with that view at the time-and were vindicated. Since bottoming in late 2020, shares of Range Resources have risen nearly twentyfold, while Antero has surged more than fiftyfold.
We believe the bearish bets now leveled against the junior uranium equities-particularly the Australian names-will, in time, prove just as misguided as those made against natural gas producers in 2020. And, in our view, the potential upside is nearly as dramatic. We encourage investors to consider assembling a portfolio of these junior uranium developers; the prospective returns, given the current dislocation, could be extraordinary.
We have spoken directly with representatives of the Sprott Physical Uranium Trust and are confident that their short-term liquidity needs will be met without difficulty-eliminating the need for any physical uranium sales. But even if a sale were to occur, we believe the impact on spot pricing would be negligible. Our sources suggest that Cameco (CCJ)-custodian of much of the Trust’s inventory-is itself materially short and would welcome the opportunity to acquire pounds. The physical uranium market is, in reality, far tighter than consensus implies, and the prevailing narrative about the Trust’s financial vulnerability is, we suspect, about to unravel. For investors, this presents a rare and timely entry point-especially among the junior names.
The uranium bull market remains intact. It is, in our judgment, only a matter of time before spot prices resume their upward march, forcing short sellers to retreat. The fundamental case continues to strengthen. China has just announced plans to build ten new nuclear reactors. Japan has restarted another unit idled since Fukushima. A Danish investment firm, 92 Capital, is in the process of raising €€350 million to invest across the nuclear supply chain, citing a growing global consensus around nuclear energy’s role as a carbon-free and reliable base load source. Even Namibia-already a significant uranium producer-has declared its intent to construct a nuclear power plant to meet surging domestic demand.
The stream of news from the global nuclear power sector grows stronger by the week. Demand is rising. Supply remains constrained. The structural gap between the two is widening-regardless of the pessimistic story now favored by the hedge fund community.
Gas’s Time Has Come
In previous letters, we’ve written at length about our conviction that North American natural gas might well prove to be the best-performing commodity in the years to come. The reasoning, though perhaps inconvenient to consensus, is rooted in arithmetic: Henry Hub prices remain a staggering 70% below both the global gas benchmark and oil on an energy-equivalent basis. This discount, once a passing oddity, has now lingered for over fifteen years. But we suspect its time is up. If we are right-and markets have a way of confirming or refuting such suspicions with a kind of merciless clarity-then gas prices here at home could well double or even triple. Not many asset classes can make such a claim.
The reason North American gas prices have remained so chronically, stubbornly low lies in a phenomenon that once dazzled investors and policymakers alike: the shale revolution. Since its early stirrings in the mid-2000s, U.S. shale gas production has surged with almost maniacal consistency, reaching an astonishing 85 billion cubic feet per day. To translate for those more accustomed to oil metrics, that’s the rough equivalent of 14 million barrels per day-enough to rank as the second-largest hydrocarbon stream in the world, eclipsed only by U.S. crude itself. It has been, in every sense, a triumph of technology and scale. But as with all great triumphs, the shadow of excess has followed close behind.
So prolific was the surge in natural gas production that the United States, almost by accident, transformed itself. Coal-fired power plants were mothballed in favor of cleaner-burning gas. Towering petrochemical complexes and nitrogen fertilizer plants sprang up like so many totems to industrial confidence. And then, most improbably, the U.S. emerged as the world’s largest exporter of liquefied natural gas-an outcome few would have predicted when shale was still a curiosity.
And yet, even with this broad new tapestry of demand, production outpaced it all. Inventories swelled. Prices sagged. The gas was too cheap, too abundant, and altogether too eager to find a home.
But even the most bountiful feast must one day dwindle. Shale formations, for all their scale, are not inexhaustible. The era of unbridled growth is behind us. As with their oil-rich cousins, the best gas drilling sites-those easy, prolific, almost arrogant wells-have been tapped. We first flagged the risk of a production peak in 2019, when such talk was still theoretical, the stuff of conference panels and footnotes. Today, it is no longer academic. It is happening.
The numbers, as always, tell the tale-if one knows where to look and has the nerve to believe them. According to the EIA, U.S. dry gas production reached its zenith in February 2024, peaking at 104.8 billion cubic feet per day. Since then, output has quietly receded by a full billion cubic feet per day. It is a modest figure at first glance, but in context, it marks one of the most acute year-over-year declines in the history of shale development. Our own models, which have proven uncomfortably accurate before, suggest this descent is only beginning.
The great gas fields of the shale era have already whispered their farewells. The Marcellus in Pennsylvania-still the heavyweight of American gas-topped out at 27.8bcf/d in late 2023. It now sits 1.2bcf/d, or roughly 5%, below that high-water mark. The Haynesville, a once-bustling engine of supply in Louisiana and East Texas, crested at 14.7bcf/d in May of last year; it has since fallen by 2.6bcf/d-nearly 20%. Only the Permian Basin, clocking in at 20.2 bcf/d, has yet to exhibit clear signs of decline. But we believe that, too, is merely a matter of time.
Our neural networks help clarify the story. In the Marcellus, dry gas production grew steadily-by about 2.1 bcf/d per year-from 2015 to 2021. But starting in 2021, growth stopped, and by 2023, production peaked. The reason was geological. As operators exhausted the most productive core areas, they were forced to drill in less productive parts of the basin. New production per lateral foot also peaked in 2021 and is now 8% lower. At the same time, total lateral footage drilled per month has remained flat. As a result, new production couldn’t offset the natural declines from existing wells. By 2023, total output reached its high and has been falling since.
In the Permian, dry gas production growth has held up better, increasing by about 200 mmcf/d each month on average over the past few years. Like the Marcellus, new production per lateral foot peaked in 2021 and is now 8% lower. But unlike the Marcellus, where drilling activity has stayed flat, the total lateral footage drilled each month in the Permian has doubled. That’s largely because oil is the main target in much of the Permian, with natural gas produced as a byproduct. This has kept drilling activity more robust than in gas-focused basins like the Marcellus, allowing the region to better offset falling productivity with more wells.
Still, every basin facing geological depletion eventually runs into limits. More drilling can delay the effects, but it cannot prevent them. That point now seems close. The Permian rig count has already dropped 10% over the past year-from 310 to 282. Given the decline in well productivity and the lower rig count, we believe the current pace of drilling is no longer enough to replace declining base production. Field output is likely to begin falling.
With the Permian as the last major source of growth, its slowdown marks a turning point. Total U.S. dry gas production now appears poised to decline meaningfully from here.
This reversal in supply couldn’t come at a worse moment. Demand is accelerating. Gas-fired power generation-much of it built to serve the exploding needs of data centers-is already ramping up. At the same time, LNG export capacity continues to expand, with the U.S. setting new records for outbound volumes in recent months. Taken together, these trends point to the fastest growth in domestic gas demand in recent memory, arriving just as the supply curve begins to bend downward.
Had the shales still been in their prime, they might have risen to meet this surge in demand. But with productivity falling and production rolling over, it now seems nearly certain that the market will slip into deficit.
The winters of 2022-2023 and 2023-2024 dealt a heavy blow to North American natural gas, with unusually mild temperatures that sharply reduced heating demand. As a result, inventories swelled to multi-year highs. This past winter, however, returned to more typical patterns, allowing both the new demand base and tightening supply trends to assert themselves. The shift was dramatic: inventories fell from nearly 700 bcf above seasonal norms at the end of the prior winter to 214 bcf below average by March. That swing points to a market running a 2.5bcf/d deficit-the tightest balance since the polar vortex winter of 2014.
While this past winter was colder than the two that preceded it, it was hardly extreme. Temperatures came in just 1% below the five-year average and remained nearly 15% warmer than the polar vortex winter of 2014-the last time the gas market was this tight. The difference now is demand. It has surged from new, structural sources.
When strong, steady demand collides with falling production, prices typically have only one direction to go. Investors in North American natural gas have had to wait longer than expected, as unusually warm winters postponed the inevitable. But as we often say, bear markets don’t last forever, rather they often live on borrow time. In the case of North American gas, that time appears to have run out.
Copper’s Inflection Point
In our previous quarterly letter, we drew attention to two quietly developing yet consequential trends in the global copper market. The first-less noticed in the daily noise of trading desks but no less significant-was the divergence between what our copper market model, grounded in World Bureau of Metal Statistics (WBMS) data, was indicating, and what actual exchange-held copper inventories were showing.
Since 2018, our modeling has consistently pointed to growing structural deficits in global copper supply-a trend not easily dismissed. And, indeed, the data from the world’s three major metal exchanges-the London Metal Exchange (LME), the Shanghai Futures Exchange, and New York’s COMEX-has corroborated this view. As the chart below illustrates, exchange inventories have been in persistent decline from 2018 through the end of 2023, retreating year after year-confirming the copper market’s deficit.
Adjusted for consumption, inventories back in December 2023 stood at levels that have only one historical parallel: the summer of 2005. Those with long memories will recall what happened next. As inventories approached vanishing point, copper prices staged a dramatic upward break. The short squeeze that began in early 2006 was swift and unsparing-copper prices doubled in a matter of weeks, catching many in the trade flat-footed.
We believe the same underlying forces were at work in the early months of 2024, when a similar squeeze began to unfold-this time with COMEX, the New York exchange, at its center. The mechanisms may differ, and the players may be new, but the script remains familiar: when inventories become this thin, markets begin to trade less on theory and more on fear. And when fear takes control, prices often move far and fast.
FIGURE 9 Copper Exchange Inventories
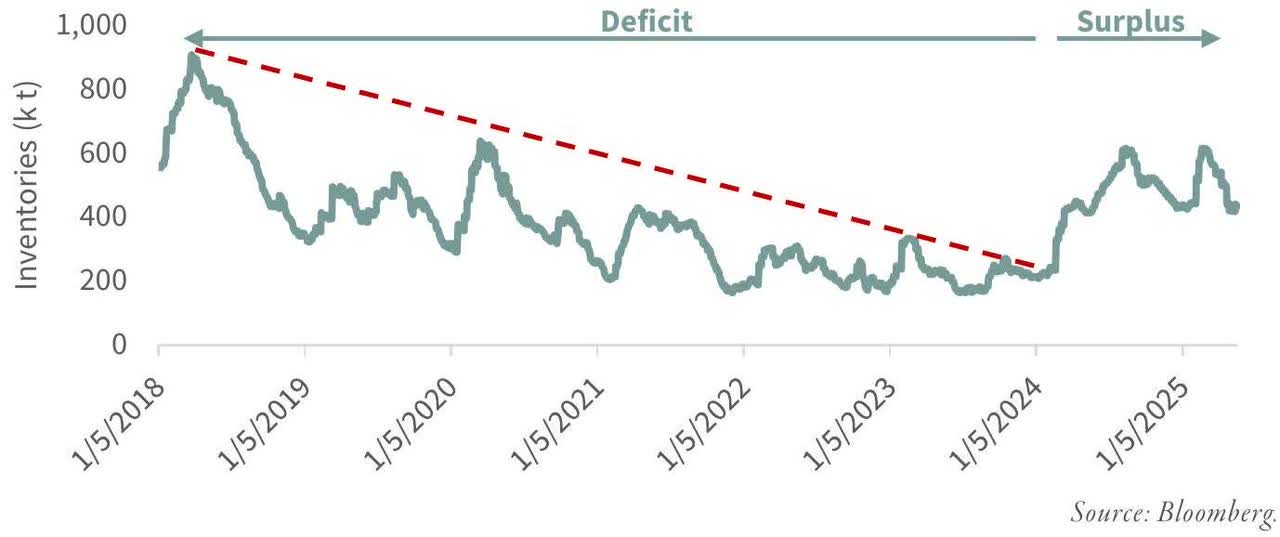
Yet markets, as ever, resist neat narratives. Following the abrupt price surge driven by the short squeeze, copper inventories began not merely to stabilize but to rise-consistently and, to our initial confusion, inexplicably. This inventory build ran counter to our modeling, which continued to show the copper market in deficit. The data and the behavior on the ground had, once again, fallen out of step.
We considered two possibilities. The first was psychological: that traders-having been scorched while short during the early 2024 squeeze-were now holding larger precautionary inventories, an understandable overcorrection in a business where memory is long and forgiveness short. The second possibility was more troubling: perhaps our model, which relies on data from the World Bureau of Metal Statistics (WBMS), was wrong. Perhaps the market had quietly tipped into surplus-one not fully captured by the statistics we trusted.
As it turns out, the second explanation appears to be correct. In its most recent release, the WBMS revised its estimates of China’s 2024 copper consumption with a decisiveness rare for bureaucratic institutions. Where once we believed that China’s copper demand was still expanding-up over 2% in our earlier model, following a striking 12% surge the year prior – it now seems that consumption has not grown, but contracted. Sharply. According to the latest WBMS figures, China’s 2024 copper consumption has declined by more than 10%.
The implications ripple outward. What we had previously modeled as a 2.5% rise in total global copper demand for 2024 now appears to have been a 4% contraction-an extraordinary reversal. As with many market misreadings, the discrepancy was not so much in the theory as in the data: the most consequential numbers are often the ones most quietly revised.
Rather than continuing the pattern of month-after-month deficits, the copper market now appears to have executed a dramatic about-face. What we once modeled as a severe short-fall-nearly 1.5 million tonnes in 2023-has, with the benefit of revised data, become a surplus of approximately 250,000 tonnes in 2024. In retrospect, our earlier modeling overstated demand, particularly in China, and understated the true state of the market. This misreading, we now believe, accounts for the nearly 400,000-tonne rise in exchange inventories witnessed over the course of last year.
But it is not merely the numbers that matter-it is what they say about China. As we’ve discussed at length in our past three letters, China’s copper consumption patterns have long adhered to a familiar and rational model: demand grows broadly in line with the infrastructure and investment required to support rising per capita GDP. For nearly a quarter century, this relationship held steady-predictable, even reassuring.
Yet in recent years, China appeared to break from that pattern, consuming copper at rates that exceeded our model’s forecasts. For a time, it looked as if a new, higher baseline had been established-perhaps a function of shifting industrial priorities or ambitious domestic investment programs. But with the latest revisions, that story has reversed. Not only is China no longer outpacing its historical relationship to copper demand-it is now underperforming it.
This is more than a statistical footnote. It marks a turning point, or at least a pause, in what had been one of the most durable drivers of global copper demand. If sustained, it would call for a reassessment not just of near-term price expectations, but of the broader thesis linking copper consumption to global growth-and particularly China’s role within it.
In our last letter, we wrote: “Over the last 25 years, analysts have consistently underestimated China’s copper consumption… However, our modeling now suggests that this era of perpetual demand surprises to the upside may be coming to an end. After years of overconsumption, Chinese demand may soon become a source of disappointment-the market’s longstanding tendency to underestimate China’s appetite may reverse, with analysts overestimating its future growth potential. This shift could represent a significant headwind for copper as the decade progresses.”
That moment may now be at hand.
As we’ve already discussed, the significance of China’s copper consumption in shaping global demand cannot be overstated. With more than 55% of global copper usage attributable to China, any deceleration-let alone a contraction-inevitably sends a strong signal through a market still largely premised on the notion of insatiable Chinese demand.
Are we witnessing the onset of a structural slowdown in China’s copper appetite? Our modeling suggests that we are. It’s a development we continue to monitor closely-and one with potentially far-reaching implications.
For all of 2024, it now appears that the global copper market slipped back into surplus. That would explain the sharp rise in exchange inventories-stocks that are readily mobilized and often tell the truest story of supply and demand. Based on the most recent WBMS revisions, global copper demand declined by nearly 1 million tonnes, or roughly 4%.
And this contraction was almost entirely driven by China. Demand there fell by nearly 1.7 million tonnes-close to 10%. Outside of China, however, copper demand remained robust. OECD economies, which still account for nearly 30% of global consumption, saw demand rise by 3.5%. And across the non-OECD, non-China cohort-markets often overlooked in global tallies-growth was strong and broad-based. Indonesia grew 12%. Malaysia, 17%. Saudi Arabia, 18%. Taiwan surged by 45%. Vietnam and others contributed to a regional increase of 6.5%. These are not small numbers, and they speak to an emerging diversification in global copper consumption.
On the supply side, a different pattern emerged. After strong gains in the latter half of 2023, copper mine production began to decelerate. Total mine output rose by nearly 900,000 tonnes in 2023-a 4% increase-driven largely by expansion in the Democratic Republic of Congo. But by early 2024, that growth had slowed. For the full year, mine supply rose by only 500,000 tonnes. The largest single contributor to the slowdown was the government-ordered shutdown of the massive Cobre Panamá mine in November 2023, which removed roughly 330,000 tonnes from expected supply.
Bringing these numbers together, the swing is clear. In 2023, we estimated a global copper deficit of roughly 1.5 million tonnes. But in 2024, with global demand at 26.5 million tonnes and supply-both mined and scrap-rising to 26.9 million tonnes, we calculate a surplus of approximately 370,000 tonnes.
It is this reversal-from deep deficit to moderate surplus-that explains the sharp and sustained rise in exchange inventories, visible in the chart above.
In past letters, we characterized our view of the copper market as short-term bullish, long-term neutral. That stance was rooted in the clear tension between steadily rising demand and a mining industry notably slow to respond. The result was a persistent supply shortfall-a condition plainly visible in the steady erosion of exchange inventories that began in 2018, as shown in the chart above.
But last year’s sharp setback in demand-centered almost entirely in China-introduces a new element of uncertainty. For years, analysts have operated under the assumption of virtually unbroken Chinese growth in copper consumption. It is a comfortable assumption, one built on decades of precedent. But what if that premise no longer holds? Is China’s once-insatiable appetite for copper finally moderating, just as our modeling has begun to suggest? Or was 2024 merely a temporary retrenchment following an extraordinarily strong 2023, when Chinese demand-fueled in part by renewable energy investment-soared by 12%?
Early WBMS data for the first two months of 2025 has further complicated the picture. Chinese demand, it seems, has come roaring back-up nearly 25% year-over-year. That rebound has been sufficient to swing the global copper market back into deficit and has already begun to pull exchange inventories lower once more. Whether this resurgence proves sustainable or fleeting remains to be seen. As ever, China will bear watching.
For now, we maintain our short-term bullish stance on copper prices. But the longer-term picture has grown more nuanced. Should China’s copper demand prove structurally slower going forward, it would represent the loss of a critical pillar supporting the bullish copper thesis. For a market long sustained by a narrative of ever-expanding demand, that would be no small development.
We approach the 2025 North American summer growing season with a measure of apprehension. In previous letters, we noted the possibility-still debated, but not easily dismissed that the Gleissberg solar cycle, a longer-term climatic rhythm recurring roughly every 88 years (or eight Schwabe 11-year cycles), may once again be asserting its influence. The last time this cycle made itself felt, it coincided-perhaps not coincidentally-with the onset of the Dust Bowl, a defining ordeal of the Great Depression.
The great Midwest drought began in the spring of 1930 and dragged on through the better part of the decade, subjecting vast portions of the central United States to sustained heat and punishing drought. The consequences, both economic and human, remain deeply etched in memory and in the historical record.
While drawing direct parallels is always fraught, we believe the risk of a significant drought in the Midwest-possibly related to the Gleissberg cycle, is one worth considering seriously. Should it materialize, the impact on growing conditions and crop yields could be considerable-an unwelcome development in any year, and especially so in a period already marked by uncertainty.
As has been the case in recent years, we are once again entering the 2025 growing season under a cloud-or more precisely, a lack thereof. Large portions of the United States are beginning the season with abnormally dry soil conditions, as the accompanying chart illustrates.
The 2024 season, it may be recalled, began under similarly dry circumstances. A timely reprieve came in the form of late-season rains, which helped avert what might have been a much more pronounced decline in yields. Even so, the dryness that prevailed throughout much of the season left its mark-though not immediately recognized. For much of the year, the USDA, in its World Agricultural Supply and Demand Estimates (WASDE), operated under the assumption that U.S. corn and soybean yields would reach record levels: 183.8 bushels per acre for corn and 53.1 for soybeans.
These projections, in turn, led to expectations of ample ending stock inventories for both crops-an outlook that exerted significant downward pressure on prices and helped foster one of the most bearish market sentiments in recent memory, as we discussed in our last letter.
It was not until the January 2025 WASDE report-months after harvest-that the USDA revised its view. Yield estimates were lowered to 179.3 for corn and 50.7 for soybeans, with corresponding ending stock estimates reduced by nearly 30%-a revision of no small consequence.
Now, as we begin another season with dry soil conditions and forecasts pointing toward further dryness, the question naturally arises: are we at risk of another overestimation in grain yields? Much will depend, as it so often does, on the weather in July. If conditions remain dry-and particularly if heat intensifies in the critical pollination window-then yield projections may once again prove overly optimistic.
FIGURE 10.1 US Shallow Groundwater Drought Indicator
Source: NASA.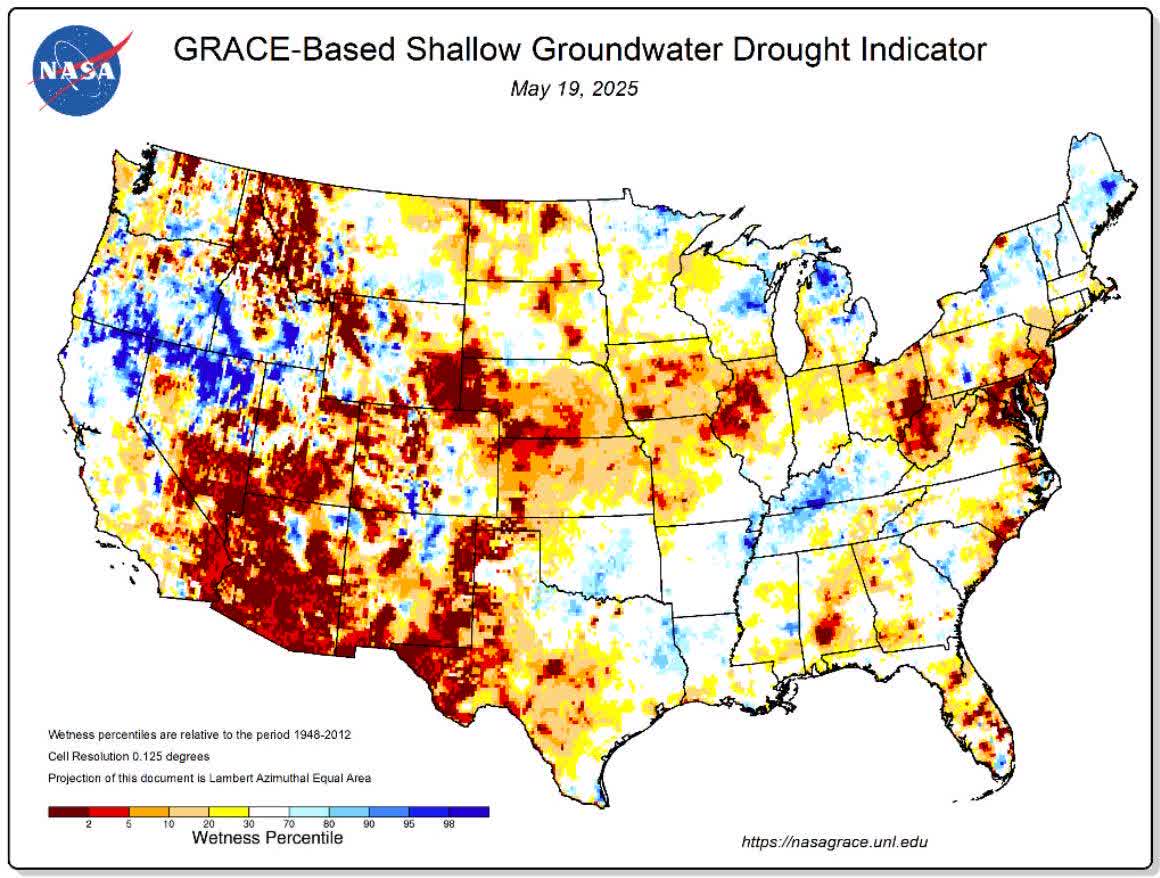
To be sure, weather remains a notoriously changeable variable. That said, current patterns suggest that the likelihood of extreme heat in the central United States this July-typically the make-or-break month for crop development-may be lower than feared. On this point, we draw insight from Shawn Hackett, President of Hackett Financial Advisors and a two-time speaker at our investor conferences. Mr. Hackett has noted that the present weakening of the Pacific Decadal Oscillation in the eastern Pacific appears likely to suppress the formation of excessive heat across the Midwest-a development that, if sustained, would be welcome news for growers.
Still, forecasts are only as reliable as the weather is stable. Should intense heat appear earlier in the summer and combine with already dry conditions, the resulting impact on yields could be profound-potentially propelling grain prices sharply higher.
It is also worth noting that, in contrast to the complacent tone struck early last year, 2025 ending stock inventories are already running well below initial expectations. In such a context, any further reductions in yield would be magnified in the market’s pricing calculus.
Importantly, this is not merely a domestic concern. Dryness at the start of this season is not confined to the United States. As the accompanying charts show, two other critical grain-producing regions-South America and Eastern Europe-are likewise contending with near-record drought. Brazil and Argentina, along with most of Eastern Europe, Ukraine, and western Russia, are all facing acute moisture deficits.
Whether or not this confluence of dryness is linked to the Gleissberg cycle is a question best left to climatologists. But the market implications are more immediate. When reduced starting inventories meet widespread growing risks across three major grain belts, the result is a highly asymmetric setup: even modest downward revisions in yield expectations could have outsized effects on prices.
Our view remains that the lows reached in grain markets during the summer of 2024 likely marked the bottom of the cycle. With inventories thinned, and dry conditions spreading from the Americas to Eastern Europe, we believe the stage is set for a potentially powerful bull run in grains-one that may gain strength if the U.S. joins the global pattern of hot, dry conditions.
FIGURE 10.2 South American Shallow Groundwater Drought Indicator
FIGURE 10.3 European Shallow Groundwater Drought Indicator
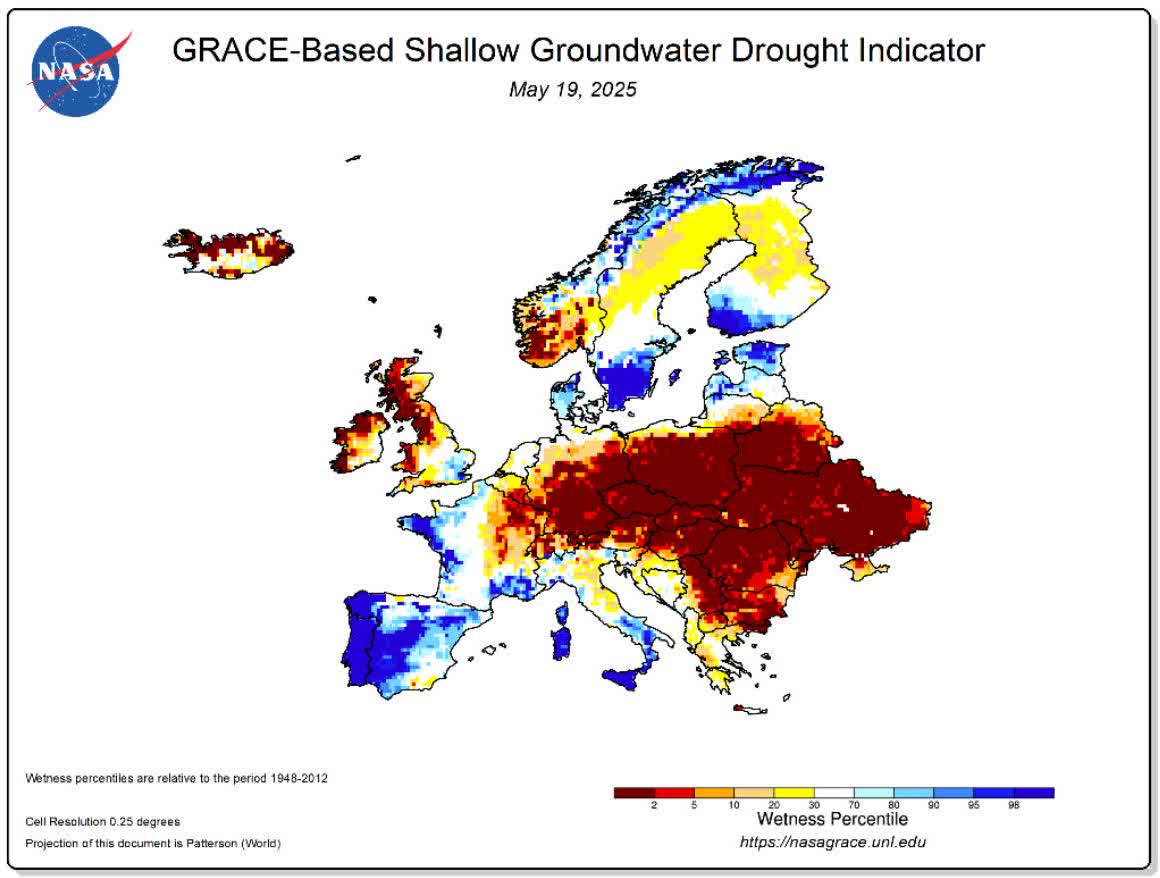
LEIGH R. GOEHRING
ADAM A. ROZENCWAJG
|
As of the date of this publication, the adviser and/or its affiliates own shares of the following companies mentioned: Anglo American Platinum Ltd, Impala Platinum Holdings Ltd, Sibanye-Stillwater Ltd, Sprott Physical Uranium Trust, Range Resources Corp, Antero Resources Corp. This creates a potential conflict of interest, as the adviser may benefit from any increase in the price of these securities. Registration with the SEC should not be construed as an endorsement or an indicator of investment skill, acumen or experience. Investments in securities are not insured, protected or guaranteed and may result in loss of income and/or principal. Historical performance is not indicative of any specific investment or future results. Investment process, strategies, philosophies, portfolio composition and allocations, security selection criteria and other parameters are current as of the date indicated and are subject to change without prior notice. This communication is distributed for informational purposes, and it is not to be construed as an offer, solicitation, recommendation, or endorsement of any particular security, products, or services. Nothing in this communication is intended to be or should be construed as individualized investment advice. All content is of a general nature and solely for educational, informational and illustrative purposes. This communication may include opinions and forward-looking statements. All statements other than statements of historical fact are opinions and/or forward-looking statements (including words such as “believe,” “estimate,” “anticipate,” “may,” “will,” should,” and “expect”). Although we believe that the beliefs and expectations reflected in such forward-looking statements are reasonable, we can give no assurance that such beliefs and expectations will prove to be correct. Various factors could cause actual results or performance to differ materially from those discussed in such forward-looking statements. All expressions of opinion are subject to change. You are cautioned not to place undue reliance on these forward-looking statements. Any dated information is published as of its date only. Dated and forward-looking statements speak only as of the date on which they are made. We undertake no obligation to update publicly or revise any dated or forward-looking statements. Any references to outside data, opinions or content are listed for informational purposes only and have not been independently verified for accuracy by the Adviser. Third-party views, opinions or forecasts do not necessarily reflect those of the Adviser or its employees. Unless stated otherwise, any mention of specific securities or investments is for illustrative purposes only. Adviser’s clients may or may not bold the securities discussed in their portfolios. Adviser makes no representations that any of the securities discussed have been or will be profitable. Past performance is not a guarantee of future results. |
Original Post
Editor’s Note: The summary bullets for this article were chosen by Seeking Alpha editors.
Read the full article here